
Business
14 years later, the effects of the 2008 bailout are still being counted
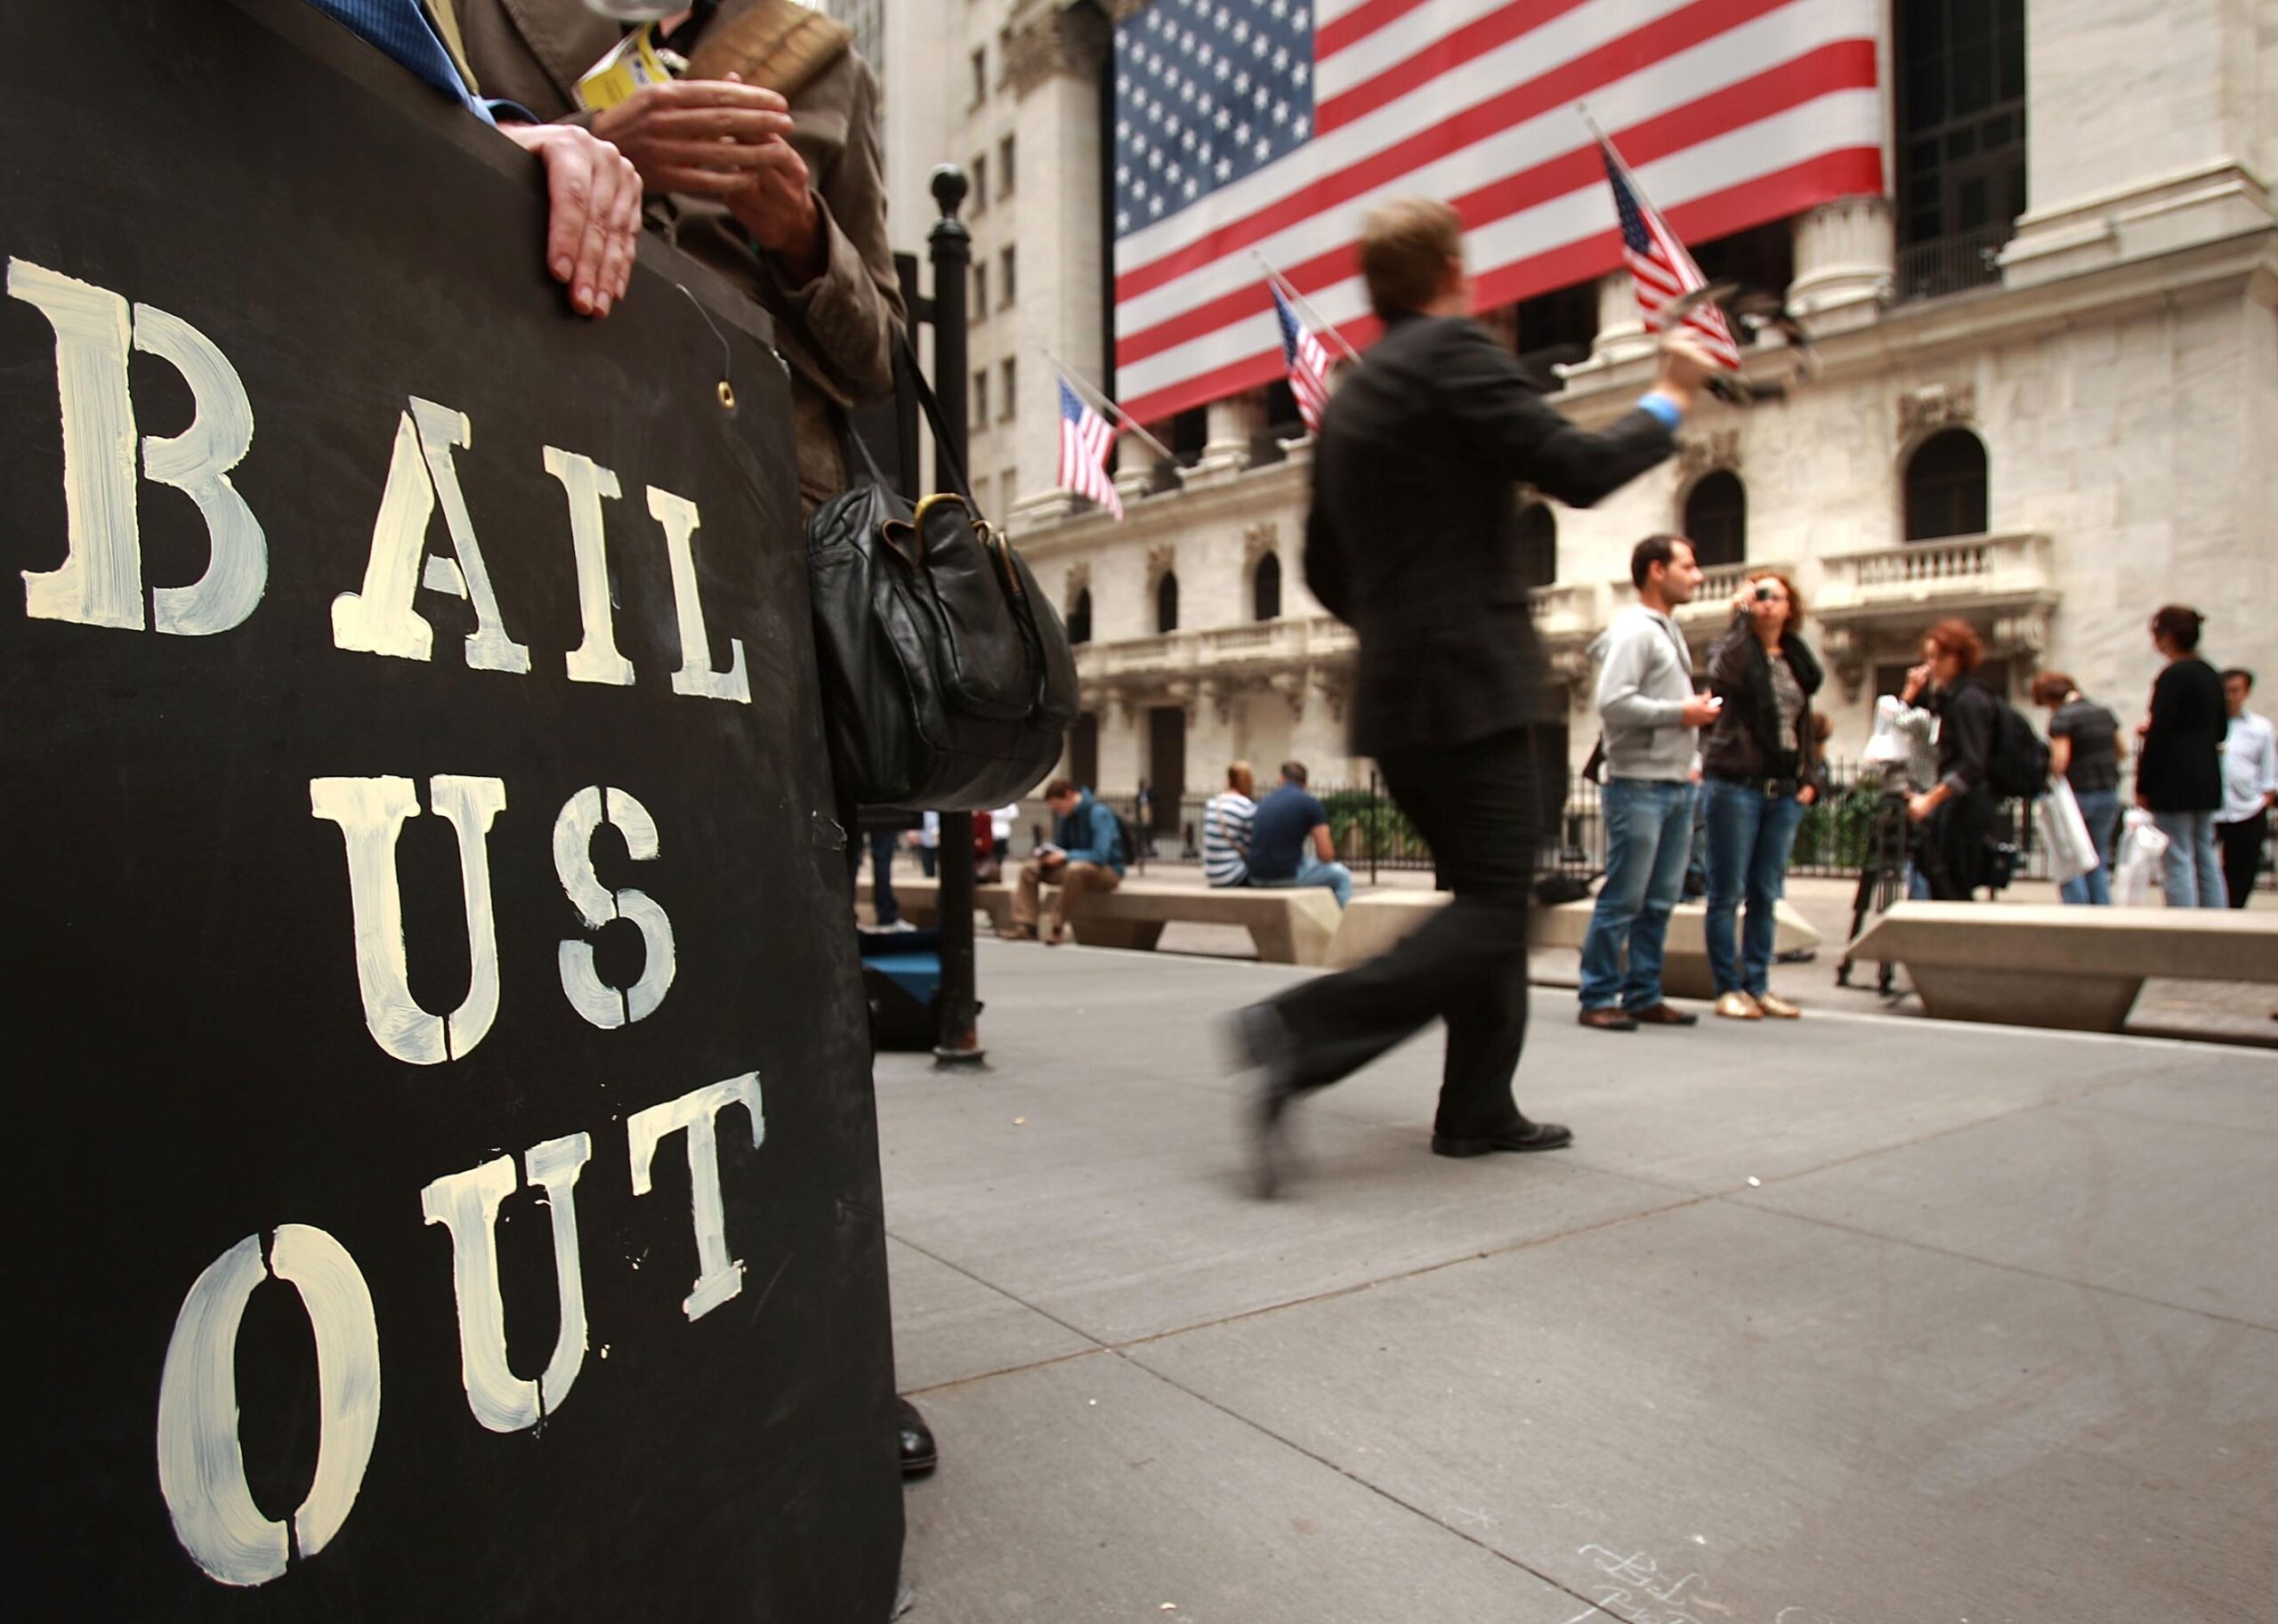
It was Monday afternoon in late September 2008 when congressional leaders rejected an initial plan to bail out America’s failing banks, plummeting the Dow Jones Index and wiping a record $1.2 trillion from American businesses.
The Great Recession was not just an American crisis but a global one in which developed countries’ interconnected banking systems were stressed simultaneously. World leaders eventually capitulated to calls by U.S. Treasury Secretary Henry Paulson and others to pump banks with capital to avoid economic collapse.
The idea of taxpayers bailing out Wall Street for short-sighted lending practices was wildly unpopular. One Republican congressman referred to the proposal as “a huge cow patty with a piece of marshmallow stuck in the middle of it.” Still, leaders worried the U.S. could plunge into a second Great Depression without action.
Packaged with financial support for homeowners and stimulus for automakers meant to prevent job losses, the concept eventually won approval in October 2008 when Congress passed the Troubled Asset Relief Program and former President George W. Bush signed the measure into law.
Stacker analyzed data about the 2008 Troubled Asset Relief Program compiled by ProPublica to see which states’ businesses have been the most responsible in paying their loan money 14 years later and found that 34 states have outstanding or failed investments that will not be paid back.
TARP was massive in its potential scope, authorizing up to $700 billion in funding, though the Treasury utilized only a fraction. The commitments broke down into $250 billion for banks, $27 billion for credit markets, $82 billion for the automotive industry, $70 billion to support the insurance giant American International Group, and $46 billion to help Americans avoid foreclosure on their homes.
Congress later passed legislation lowering the disbursement cap for TARP to $475 billion in 2010 and lost its authority to approve any new bailout commitments that same year.
By 2013, the watchdog group overseeing TARP and enforcing its rules pursued charges against 107 senior bank officials alleged to have misused bailout funds, most of whom received prison time, according to an analysis by the Washington Post. In 2016, TARP wound down its investments, including in companies such as AIG, declaring it had recouped disbursements.
In total, $635 billion has been distributed; $17 billion are considered lost or a failed investment.
Funds that were committed to helping Americans avoid foreclosure and were never meant to be repaid were ongoing up to the onset of the COVID-19 pandemic, which saw the U.S. government issue $800 billion in Paycheck Protection Program loans intended to keep Americans employed—nearly all of which is expected to be forgiven.
Read on to see how businesses in your state repaid their funds—or didn’t.
You may also like: Famous consumer brands that no longer exist
![]()
Canva
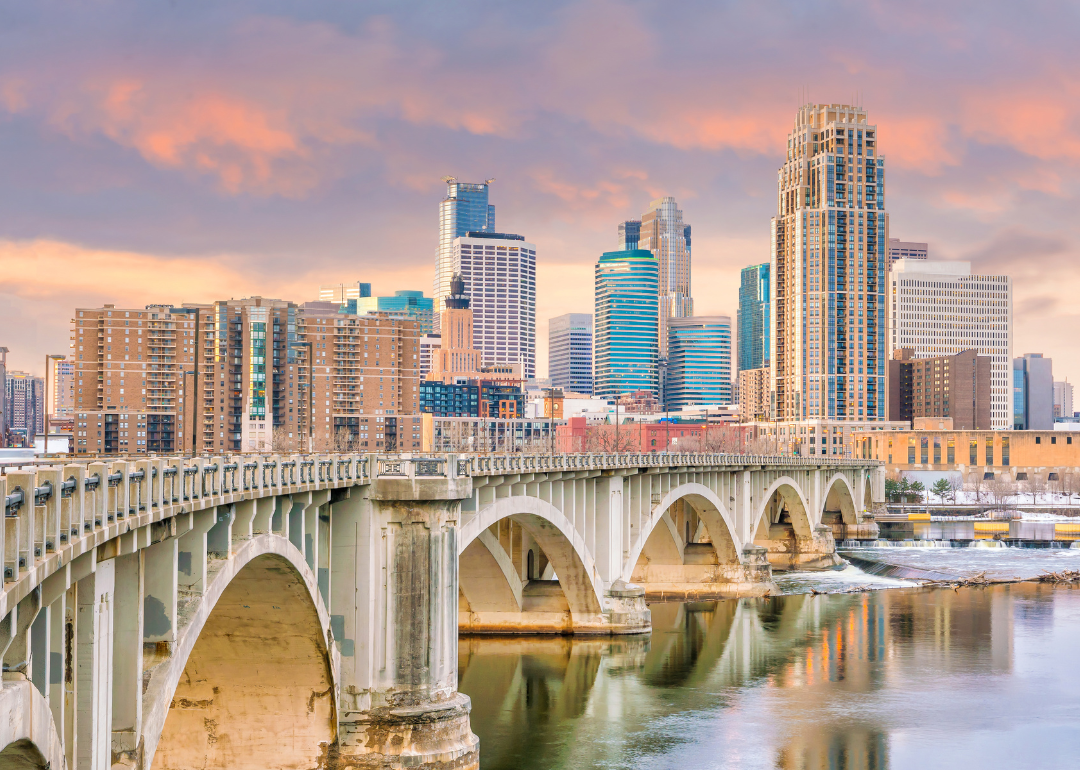
#34. Minnesota
– Percent of total disbursement unrepaid: 0.03%
– Unrepaid bailout amount: $2.2 million (out of $7.4 billion disbursed to Minnesota)
– Per capita disbursement: $1,298 with $0.38 lost per capita
– Single biggest loan: $6.6 billion to U.S. Bancorp
Canva
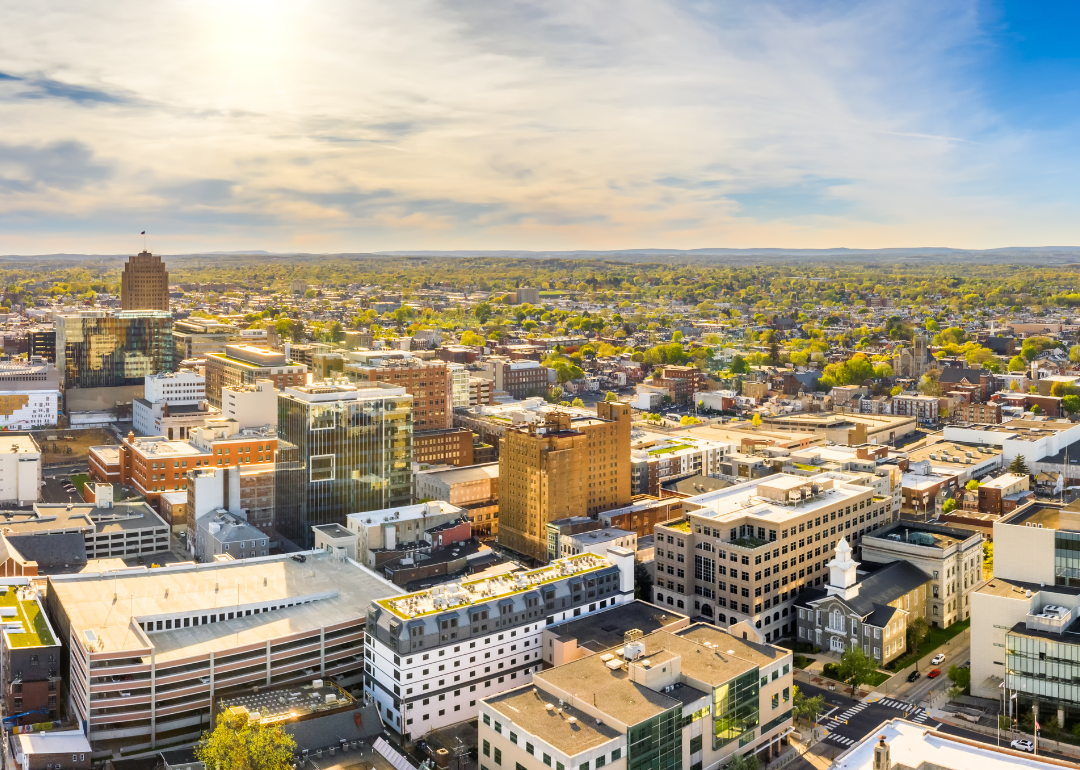
#33. Pennsylvania
– Percent of total disbursement unrepaid: 0.08%
– Unrepaid bailout amount: $8.5 million (out of $10.2 billion disbursed to Pennsylvania)
– Per capita disbursement: $787 with $0.66 lost per capita
– Single biggest loan: $7.6 billion to PNC Financial Services
Canva
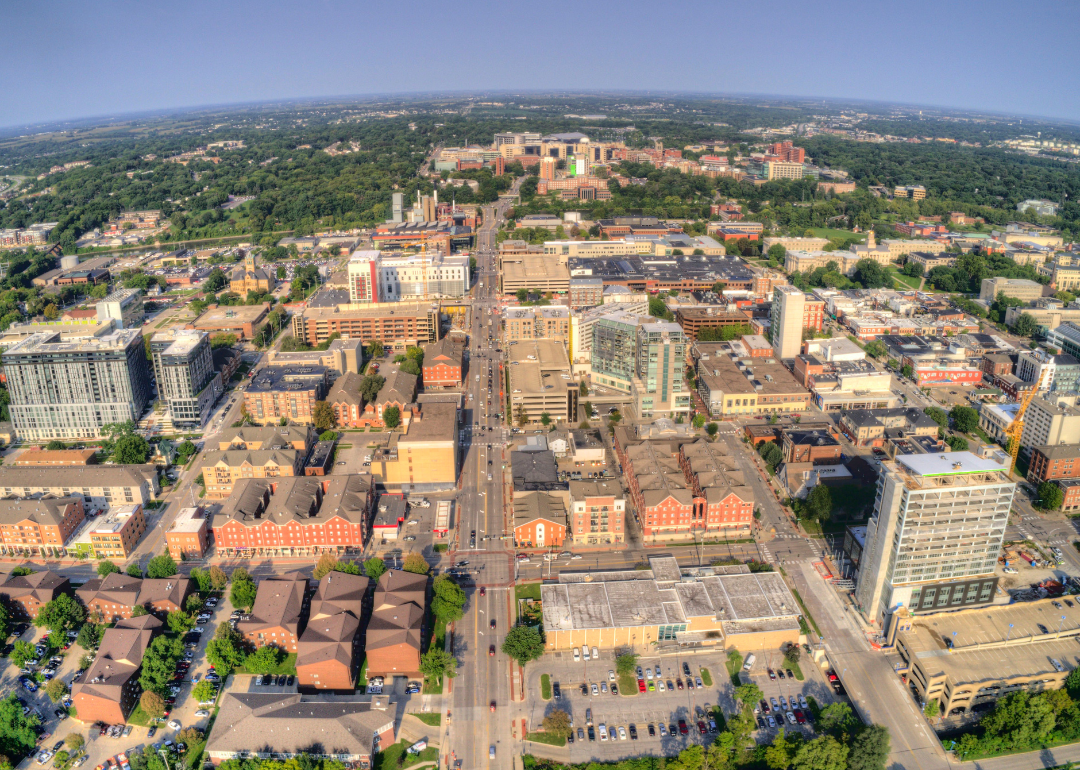
#32. Iowa
– Percent of total disbursement unrepaid: 0.09%
– Unrepaid bailout amount: $3.2 million (out of $3.6 billion disbursed to Iowa)
– Per capita disbursement: $1,124 with $1.00 lost per capita
– Single biggest loan: $3.4 billion to Wells Fargo Bank, NA
Canva
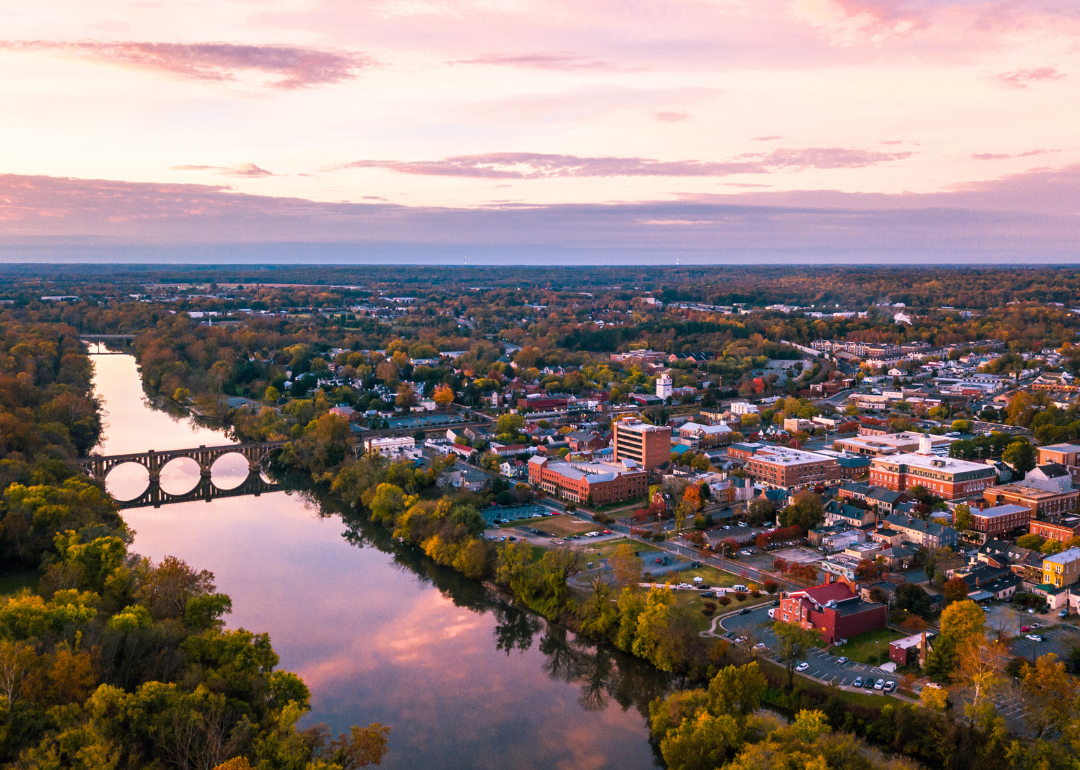
#31. Virginia
– Percent of total disbursement unrepaid: 0.12%
– Unrepaid bailout amount: $89.2 million (out of $75.9 billion disbursed to Virginia)
– Per capita disbursement: $8,782 with $10.32 lost per capita
– Single biggest loan: $71.6 billion to Freddie Mac

Canva
#30. North Carolina
– Percent of total disbursement unrepaid: 0.12%
– Unrepaid bailout amount: $59.2 million (out of $49.4 billion disbursed to North Carolina)
– Per capita disbursement: $4,683 with $5.61 lost per capita
– Single biggest loan: $45.0 billion to Bank of America
You may also like: Most popular department stores in America

Canva
#29. New Jersey
– Percent of total disbursement unrepaid: 0.19%
– Unrepaid bailout amount: $8.1 million (out of $4.3 billion disbursed to New Jersey)
– Per capita disbursement: $465 with $0.88 lost per capita
– Single biggest loan: $3.2 billion to JPMorgan Chase subsidiaries
Canva
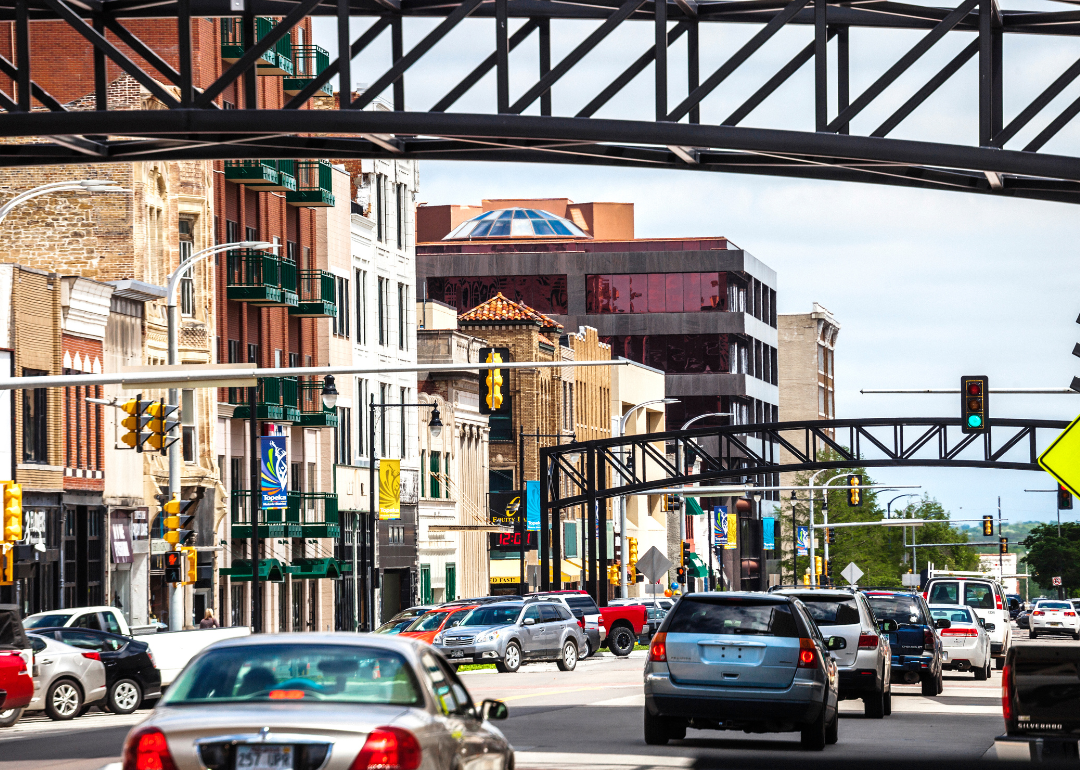
#28. Kansas
– Percent of total disbursement unrepaid: 0.19%
– Unrepaid bailout amount: $0.3 million (out of $142.4 million disbursed to Kansas)
– Per capita disbursement: $49 with $0.09 lost per capita
– Single biggest loan: $36.3 million to Fidelity Financial Corp
Canva
#27. Mississippi
– Percent of total disbursement unrepaid: 0.30%
– Unrepaid bailout amount: $2.0 million (out of $665.5 million disbursed to Mississippi)
– Per capita disbursement: $226 with $0.68 lost per capita
– Single biggest loan: $215.0 million to Trustmark Corp

Canva
#26. Texas
– Percent of total disbursement unrepaid: 0.31%
– Unrepaid bailout amount: $15.9 million (out of $5.2 billion disbursed to Texas)
– Per capita disbursement: $176 with $0.54 lost per capita
– Single biggest loan: $2.3 billion to Comerica Incorporated
Canva
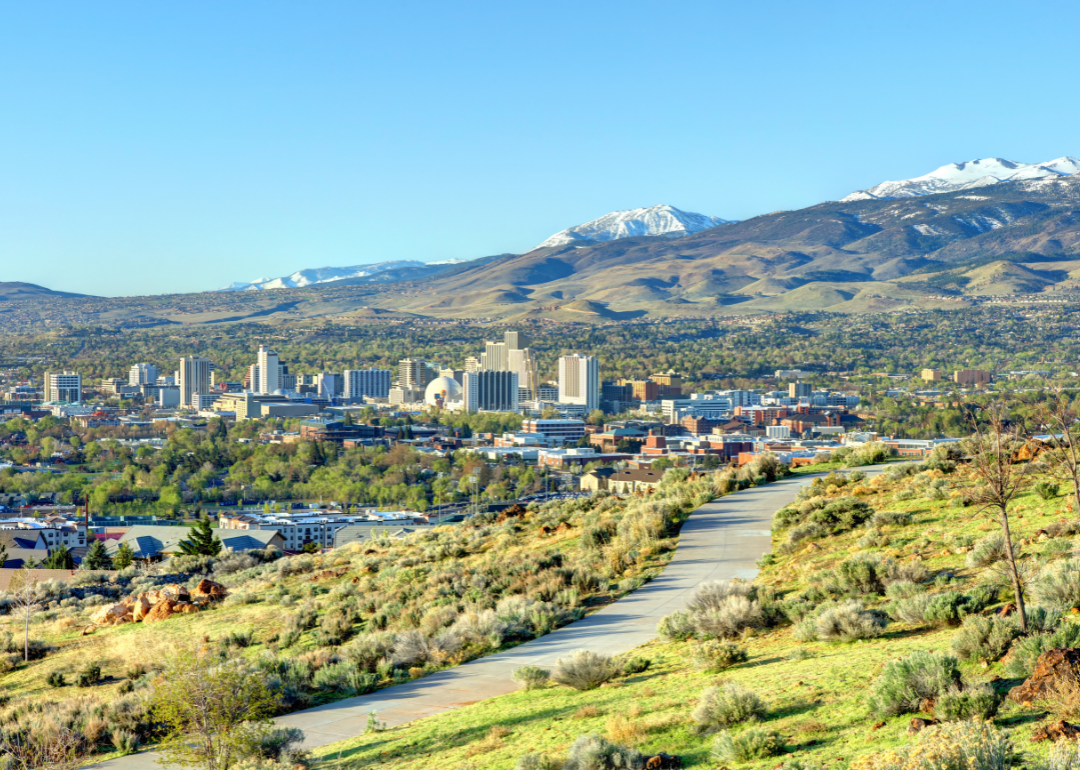
#25. Nevada
– Percent of total disbursement unrepaid: 0.41%
– Unrepaid bailout amount: $1.4 million (out of $340.1 million disbursed to Nevada)
– Per capita disbursement: $108 with $0.44 lost per capita
– Single biggest loan: $196.2 million to Nevada Affordable Housing Assistance Corporation
You may also like: 50 car companies that no longer exist
Canva
#24. Georgia
– Percent of total disbursement unrepaid: 0.45%
– Unrepaid bailout amount: $29.6 million (out of $6.7 billion disbursed to Georgia)
– Per capita disbursement: $616 with $2.74 lost per capita
– Single biggest loan: $4.9 billion to SunTrust
Canva
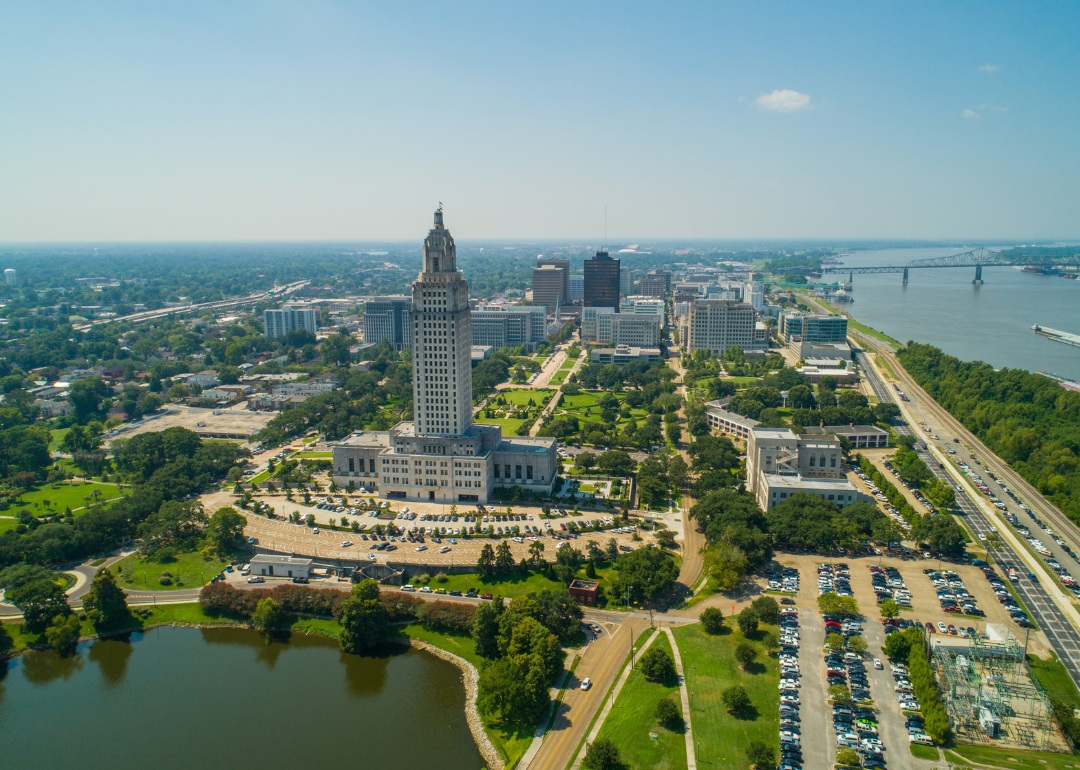
#23. Louisiana
– Percent of total disbursement unrepaid: 0.50%
– Unrepaid bailout amount: $2.7 million (out of $537.8 million disbursed to Louisiana)
– Per capita disbursement: $116 with $0.58 lost per capita
– Single biggest loan: $300.0 million to Citizens Republic Bancorp
Canva
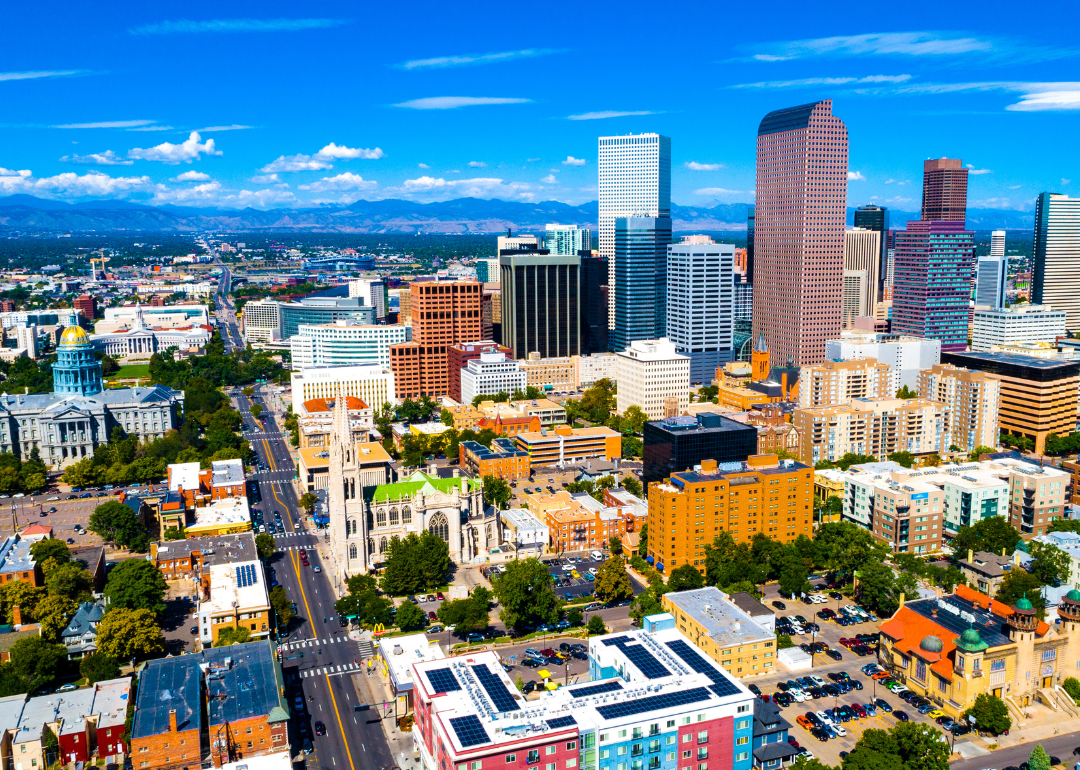
#22. Colorado
– Percent of total disbursement unrepaid: 0.73%
– Unrepaid bailout amount: $5.3 million (out of $728.6 million disbursed to Colorado)
– Per capita disbursement: $125 with $0.92 lost per capita
– Single biggest loan: $428.9 million to Specialized Loan Servicing LLC

Canva
#21. Ohio
– Percent of total disbursement unrepaid: 0.80%
– Unrepaid bailout amount: $69.5 million (out of $8.7 billion disbursed to Ohio)
– Per capita disbursement: $738 with $5.90 lost per capita
– Single biggest loan: $3.4 billion to Fifth Third Bancorp
Canva
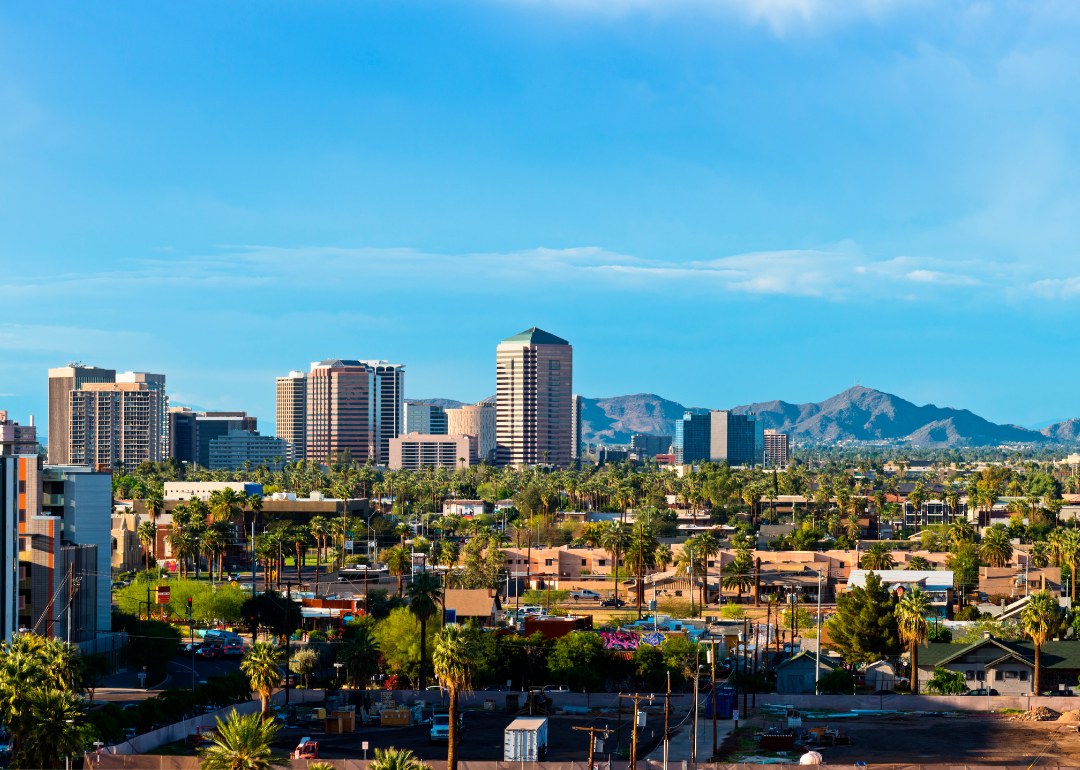
#20. Arizona
– Percent of total disbursement unrepaid: 0.85%
– Unrepaid bailout amount: $2.6 million (out of $309.3 million disbursed to Arizona)
– Per capita disbursement: $43 with $0.36 lost per capita
– Single biggest loan: $296.1 million to Arizona (Home) Foreclosure Prevention Funding Corporation
You may also like: Retirement scams to watch out for

Canva
#19. California
– Percent of total disbursement unrepaid: 1.09%
– Unrepaid bailout amount: $362.8 million (out of $33.2 billion disbursed to California)
– Per capita disbursement: $847 with $9.25 lost per capita
– Single biggest loan: $25.0 billion to JPMorgan Chase

Canva
#18. New York
– Percent of total disbursement unrepaid: 1.36%
– Unrepaid bailout amount: $2.3 billion (out of $168.1 billion disbursed to New York)
– Per capita disbursement: $8,473 with $115.26 lost per capita
– Single biggest loan: $67.8 billion to AIG
Canva
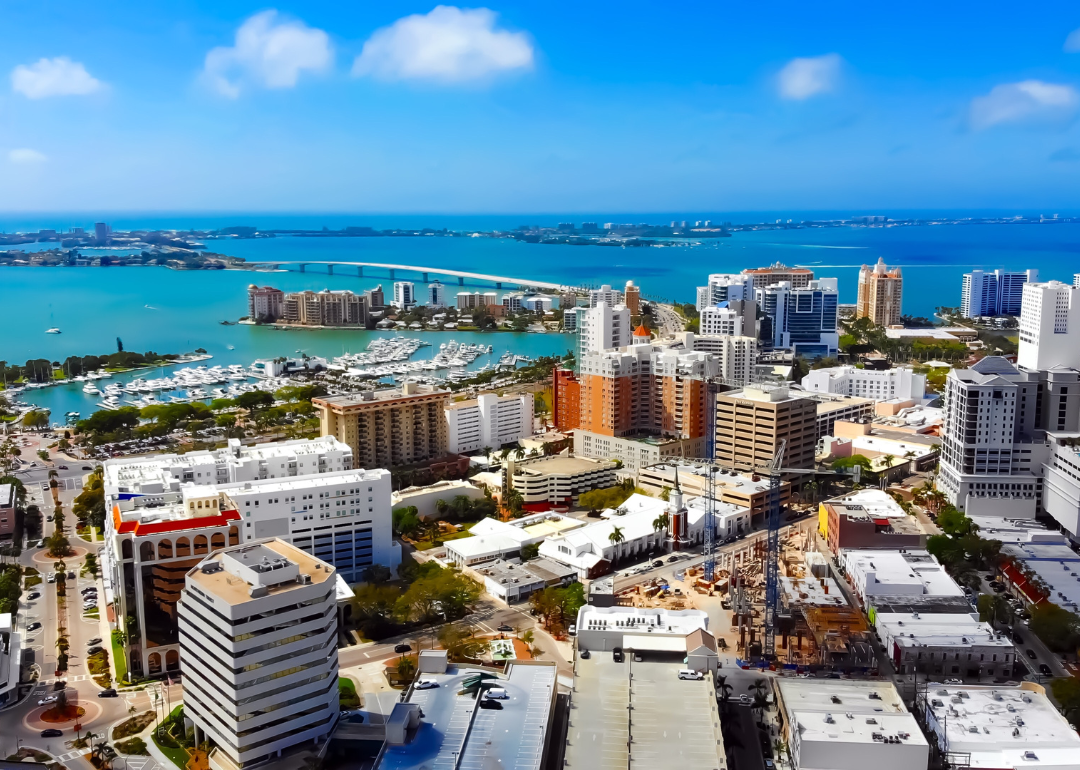
#17. Florida
– Percent of total disbursement unrepaid: 1.52%
– Unrepaid bailout amount: $105.4 million (out of $6.9 billion disbursed to Florida)
– Per capita disbursement: $318 with $4.84 lost per capita
– Single biggest loan: $5.0 billion to PHH Mortgage, a subsidiary of Ocwen Financial Corporation
Canva
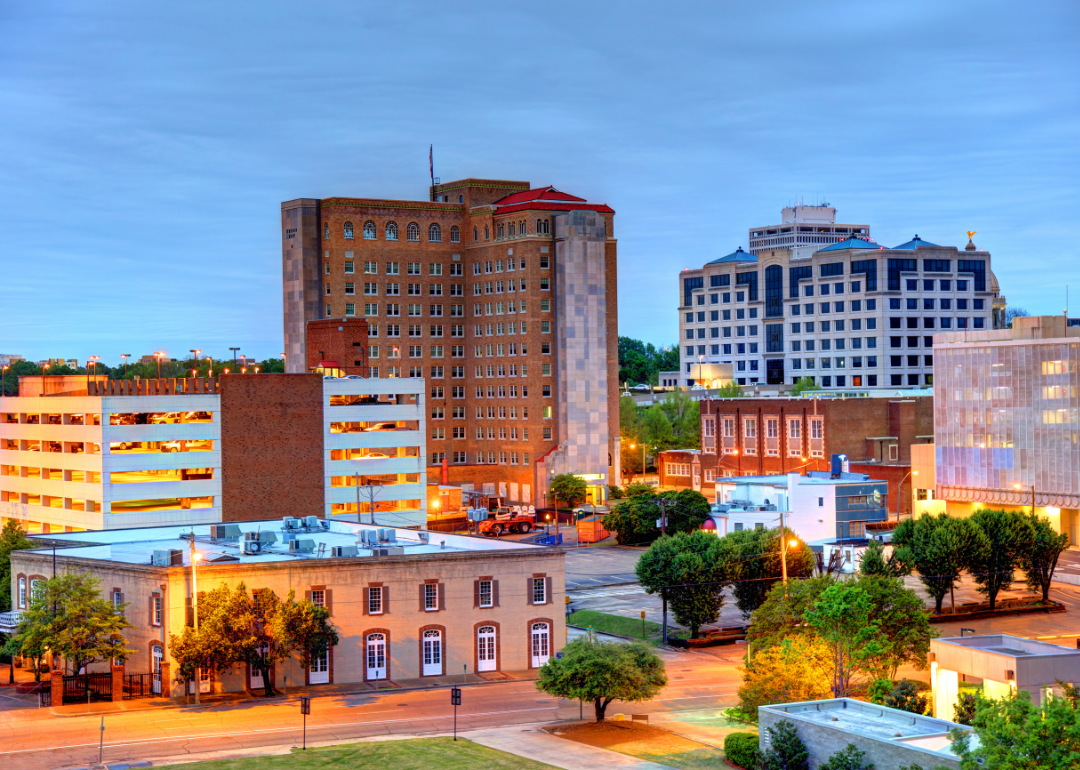
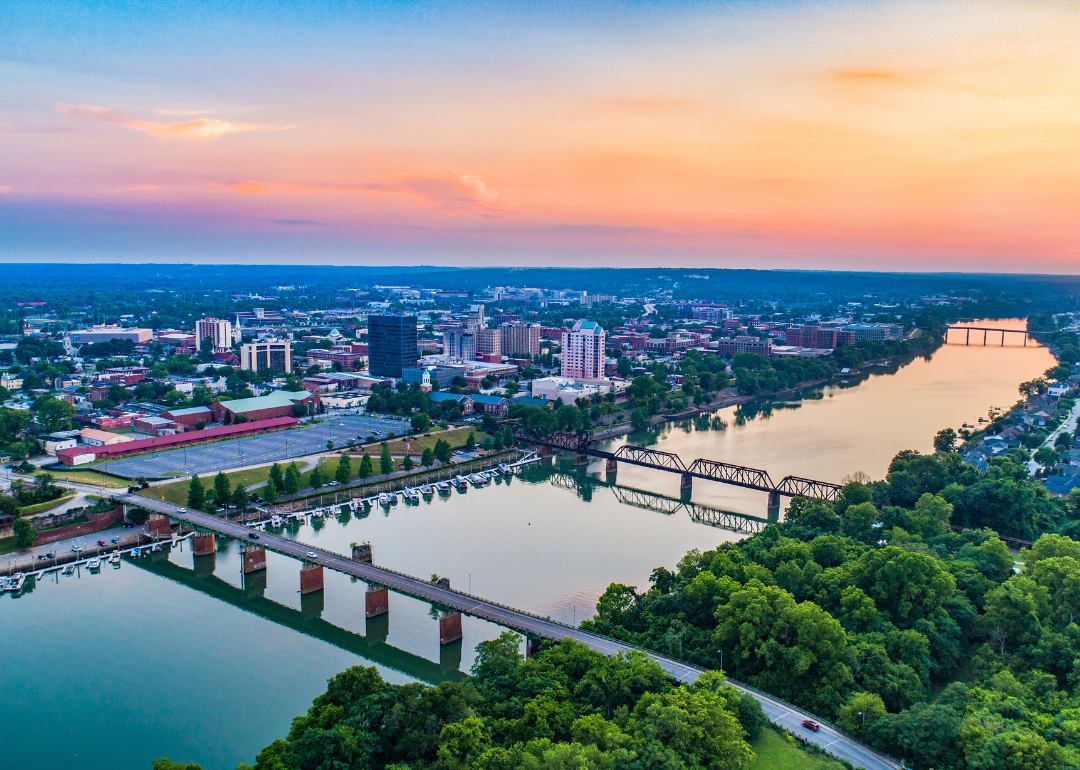
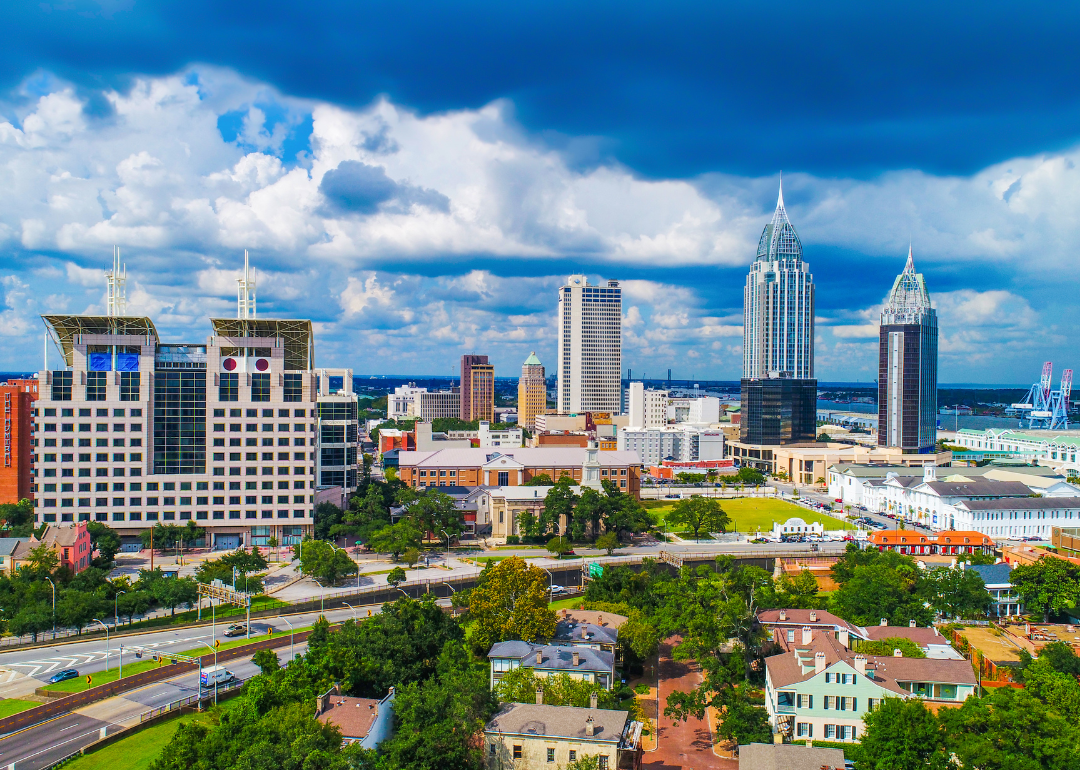
#16. Alabama
– Percent of total disbursement unrepaid: 1.68%
– Unrepaid bailout amount: $64.0 million (out of $3.8 billion disbursed to Alabama)
– Per capita disbursement: $754 with $12.70 lost per capita
– Single biggest loan: $3.5 billion to Regions Financial Corp.
Canva
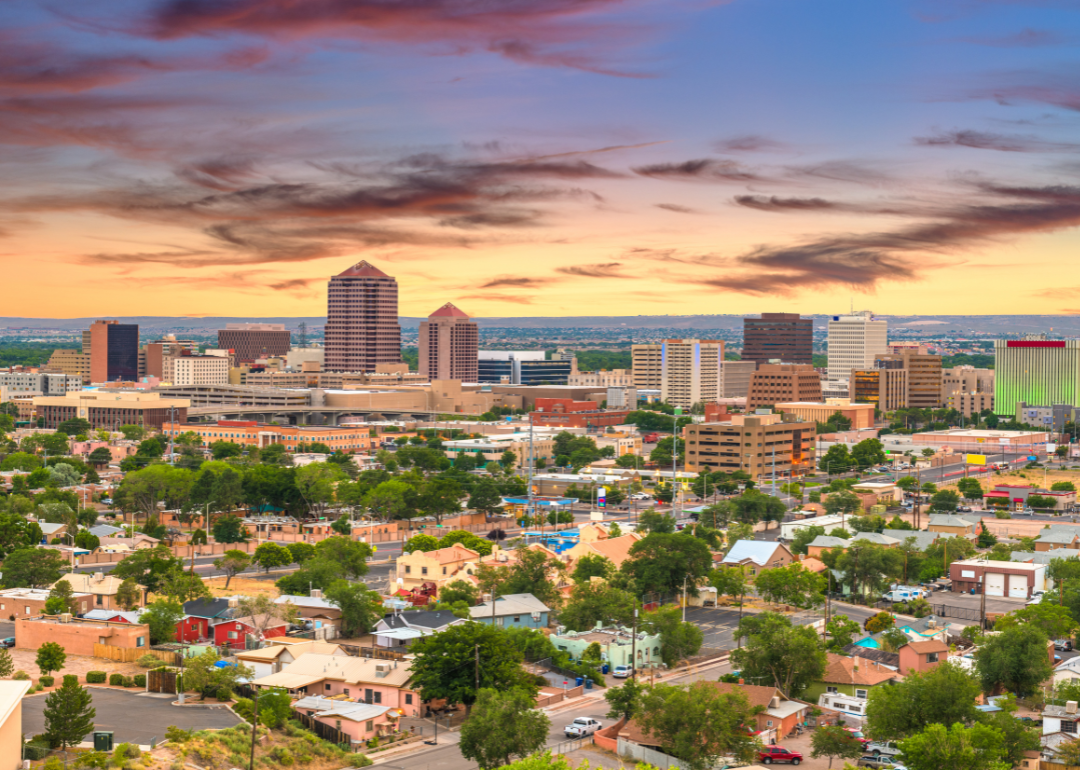
#15. New Mexico
– Percent of total disbursement unrepaid: 1.86%
– Unrepaid bailout amount: $0.9 million (out of $48.1 million disbursed to New Mexico)
– Per capita disbursement: $23 with $0.42 lost per capita
– Single biggest loan: $35.5 million to Trinity Capital Corporation
You may also like: Cost of gold the year you were born
Canva
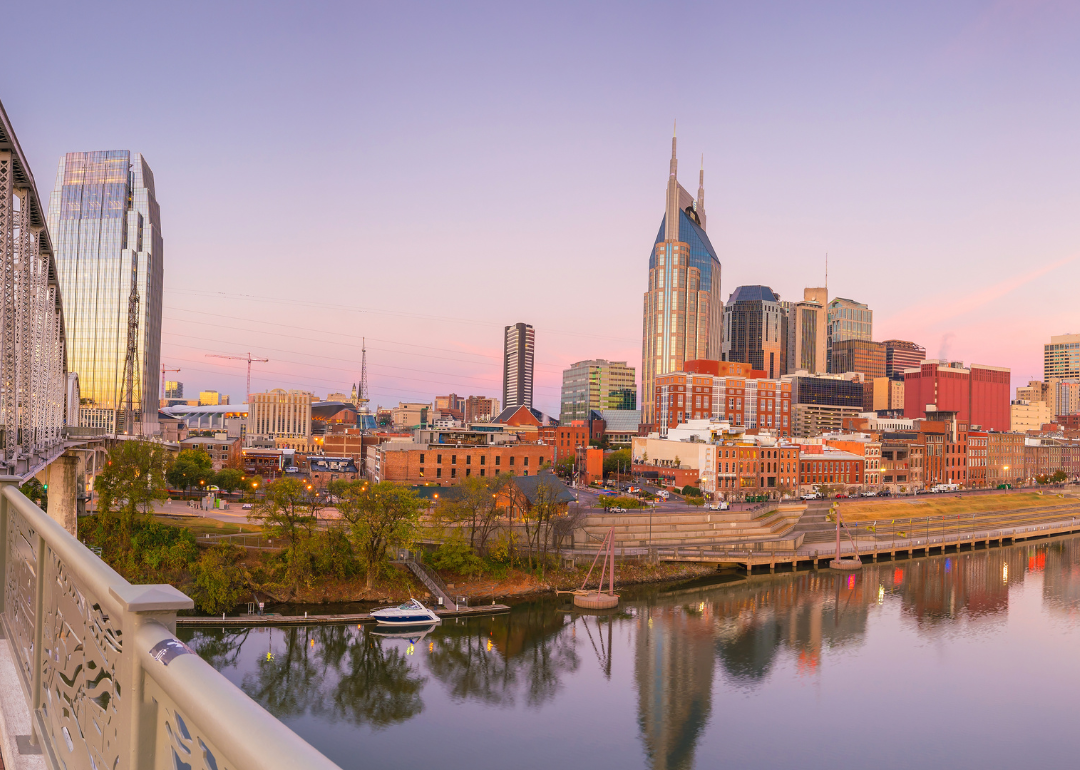
#14. Tennessee
– Percent of total disbursement unrepaid: 3.40%
– Unrepaid bailout amount: $54.6 million (out of $1.6 billion disbursed to Tennessee)
– Per capita disbursement: $230 with $7.83 lost per capita
– Single biggest loan: $866.5 million to First Horizon National
Canva
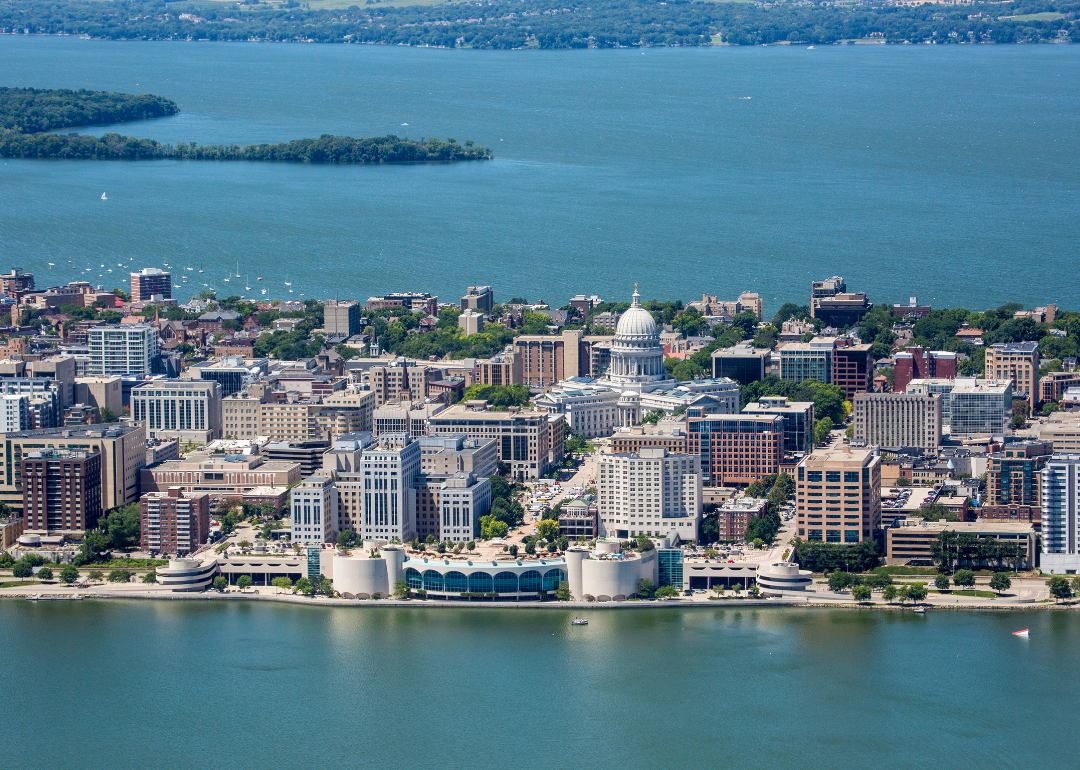
#13. Wisconsin
– Percent of total disbursement unrepaid: 4.64%
– Unrepaid bailout amount: $116.7 million (out of $2.5 billion disbursed to Wisconsin)
– Per capita disbursement: $427 with $19.80 lost per capita
– Single biggest loan: $1.7 billion to Marshall & Ilsley

Canva
#12. Illinois
– Percent of total disbursement unrepaid: 4.79%
– Unrepaid bailout amount: $260.5 million (out of $5.4 billion disbursed to Illinois)
– Per capita disbursement: $429 with $20.56 lost per capita
– Single biggest loan: $1.6 billion to Northern Trust
Canva
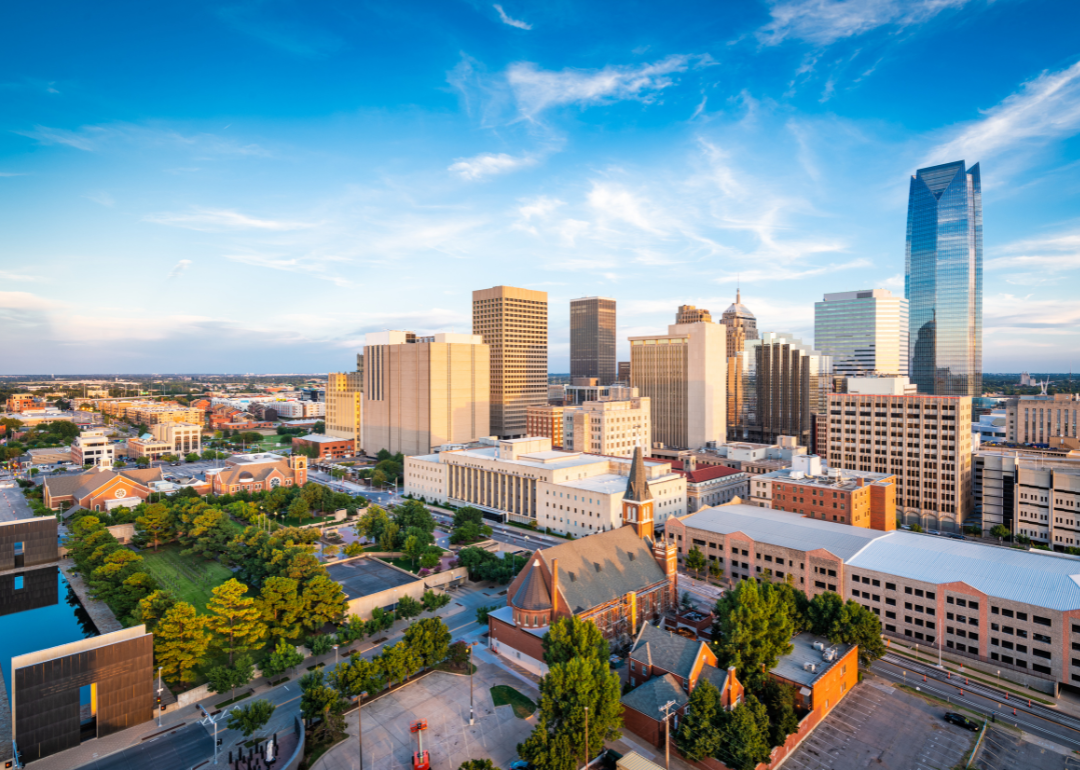
#11. Oklahoma
– Percent of total disbursement unrepaid: 5.05%
– Unrepaid bailout amount: $18.1 million (out of $358.4 million disbursed to Oklahoma)
– Per capita disbursement: $90 with $4.54 lost per capita
– Single biggest loan: $232.8 million to MidFirst Bank
Canva
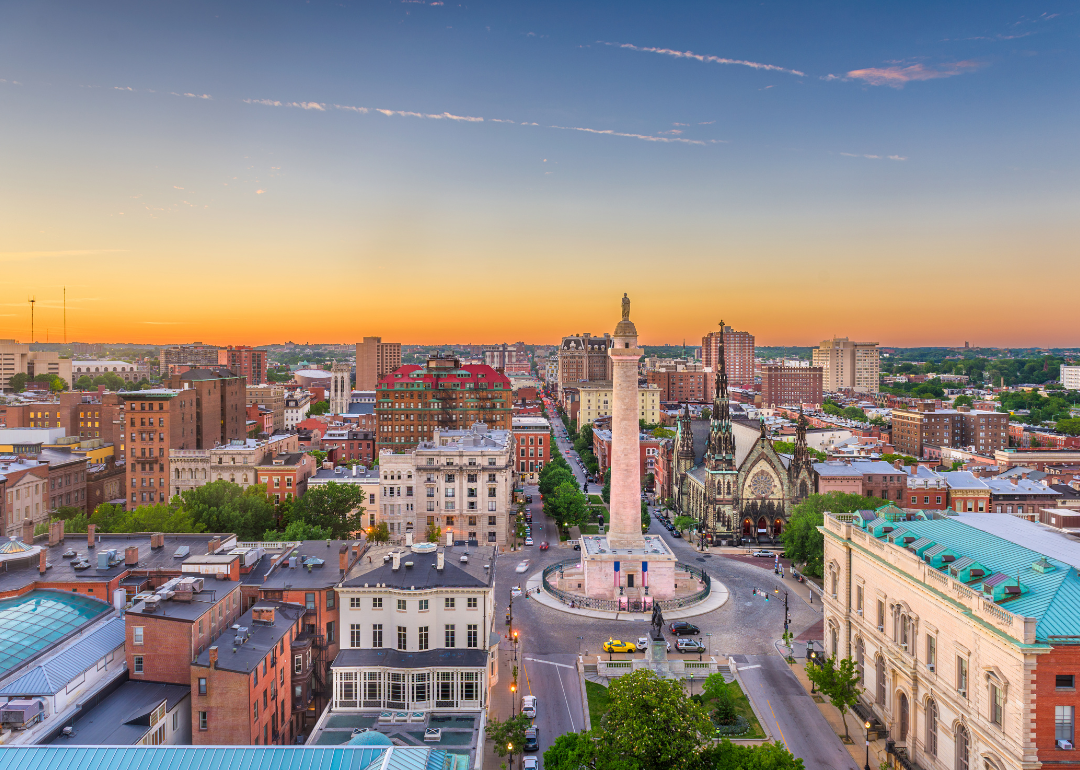
#10. Maryland
– Percent of total disbursement unrepaid: 5.15%
– Unrepaid bailout amount: $23.6 million (out of $458.7 million disbursed to Maryland)
– Per capita disbursement: $74 with $3.83 lost per capita
– Single biggest loan: $151.5 million to Provident Bankshares Corp.
You may also like: 25 richest families in America
Canva
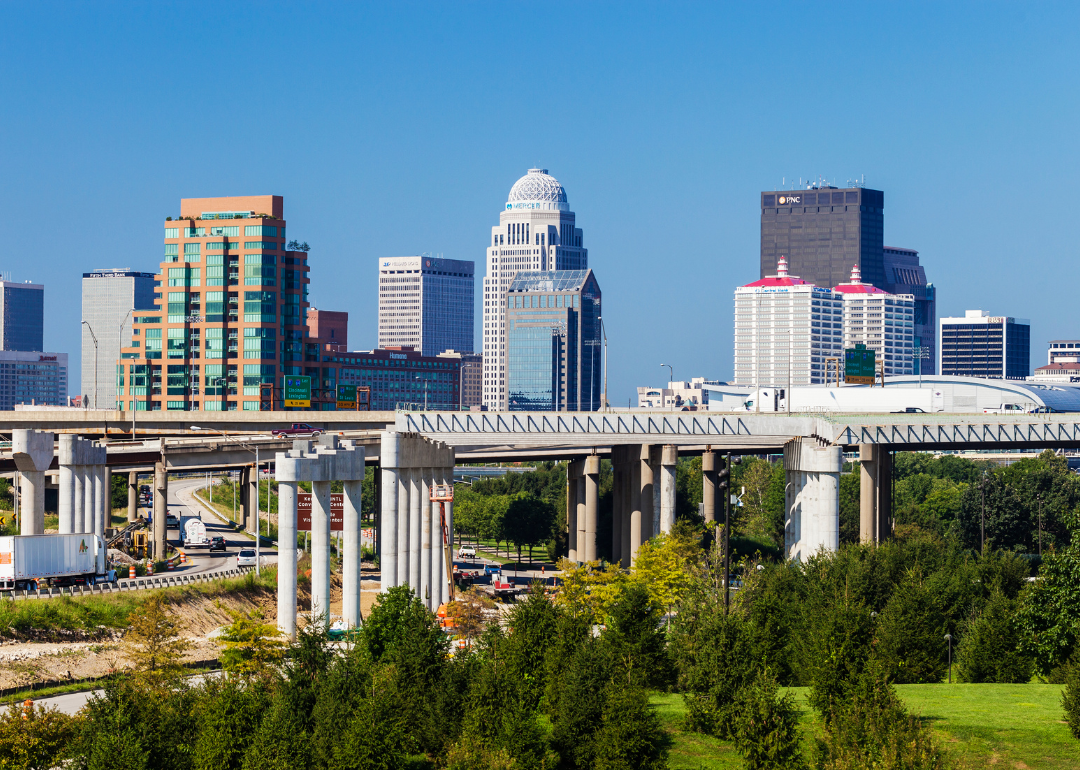
#9. Kentucky
– Percent of total disbursement unrepaid: 6.74%
– Unrepaid bailout amount: $38.9 million (out of $576.3 million disbursed to Kentucky)
– Per capita disbursement: $128 with $8.62 lost per capita
– Single biggest loan: $200.3 million to U.S. Bank National Association
Canva
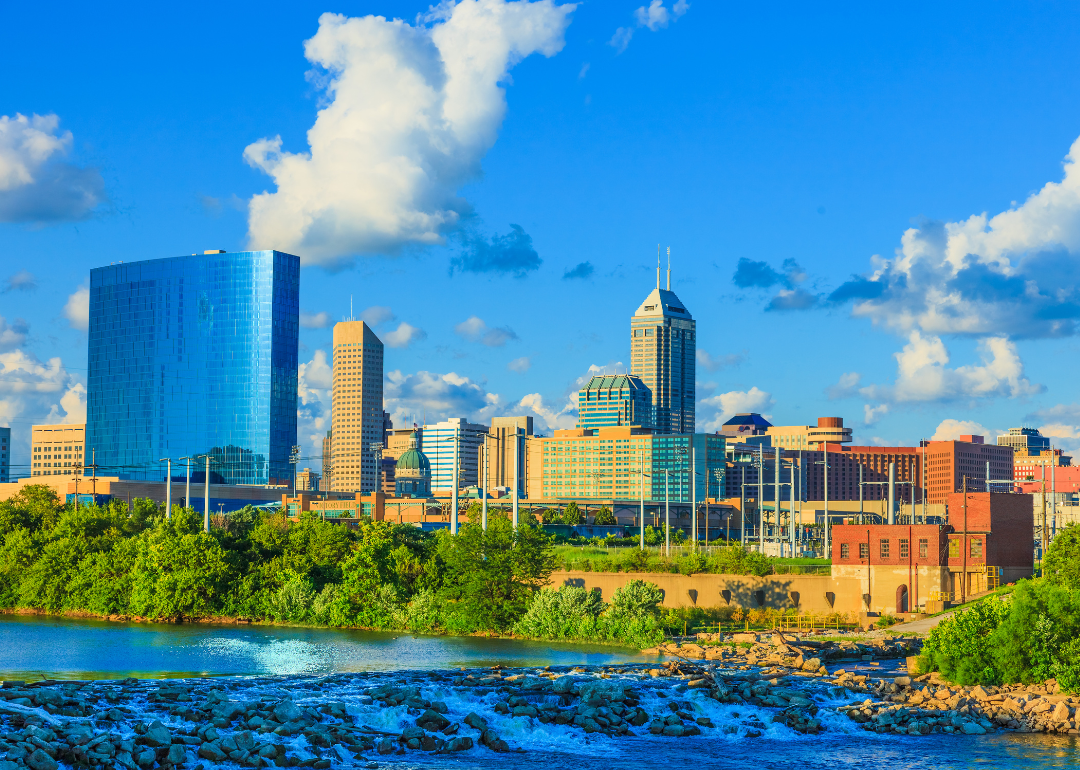
#8. Indiana
– Percent of total disbursement unrepaid: 9.16%
– Unrepaid bailout amount: $87.3 million (out of $953.1 million disbursed to Indiana)
– Per capita disbursement: $140 with $12.82 lost per capita
– Single biggest loan: $284.0 million to Indiana Housing and Community Development Authority
Canva
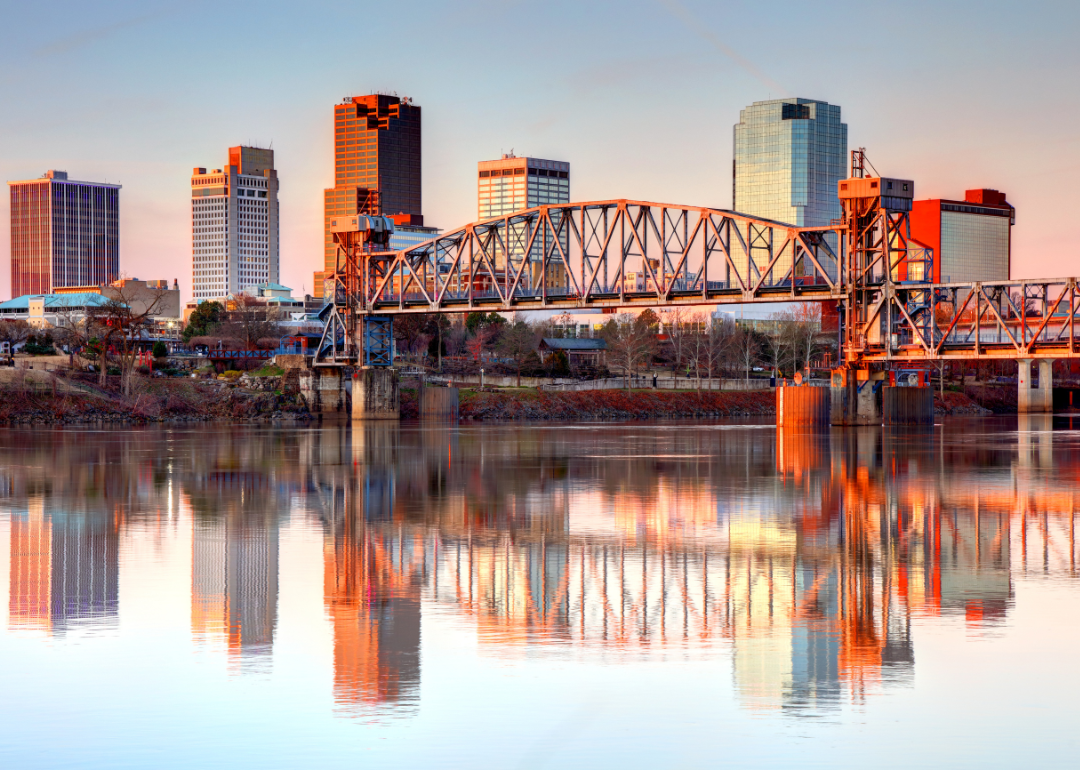
#7. Arkansas
– Percent of total disbursement unrepaid: 12.36%
– Unrepaid bailout amount: $40.3 million (out of $326.2 million disbursed to Arkansas)
– Per capita disbursement: $108 with $13.32 lost per capita
– Single biggest loan: $75.0 million to Bank of the Ozarks
Canva
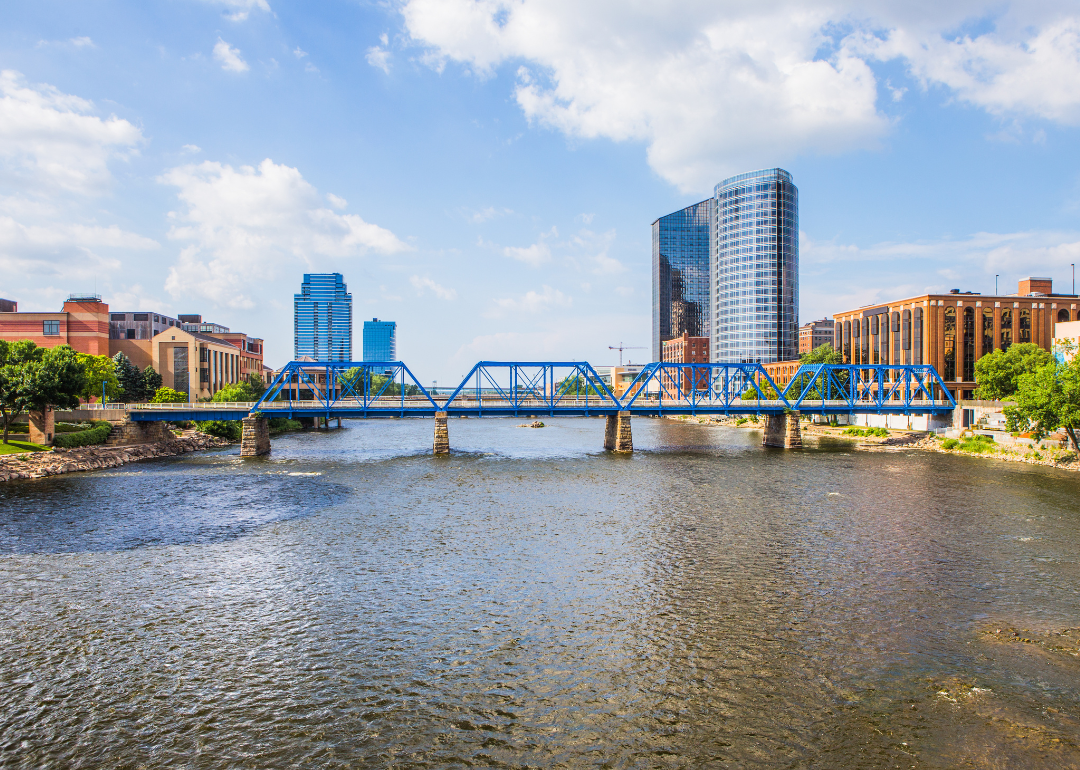
#6. Michigan
– Percent of total disbursement unrepaid: 15.50%
– Unrepaid bailout amount: $12.5 billion (out of $80.8 billion disbursed to Michigan)
– Per capita disbursement: $8,038 with $1246.04 lost per capita
– Single biggest loan: $50.7 billion to General Motors
Canva
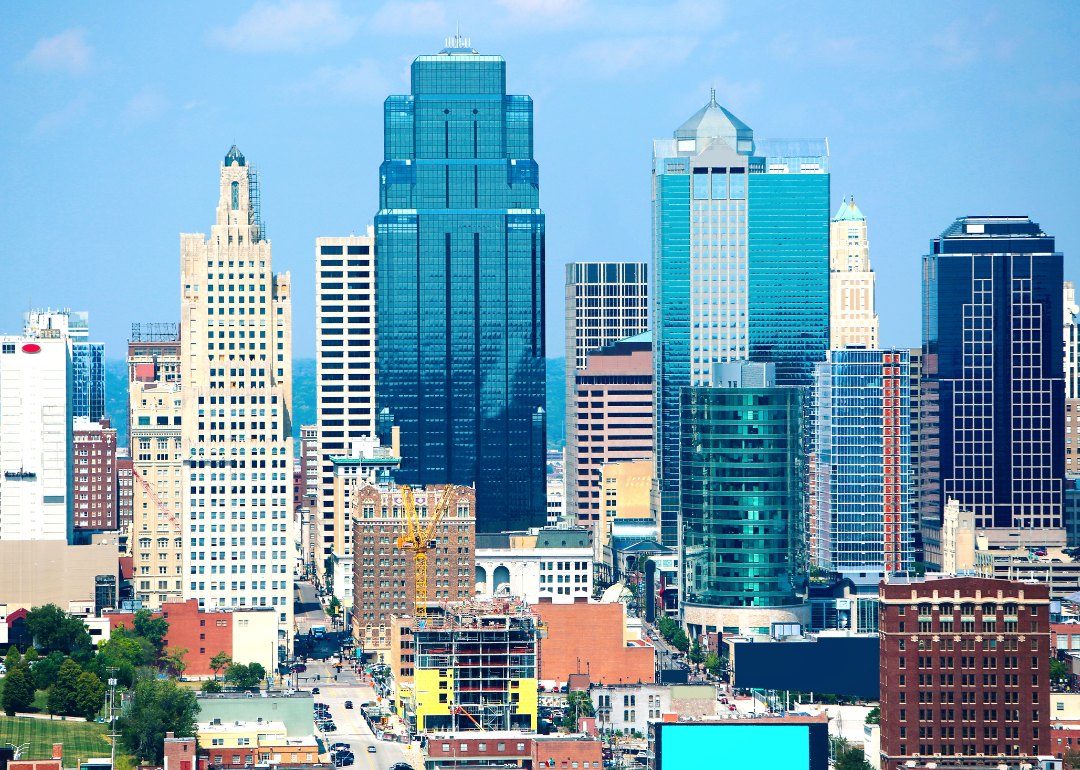
#5. Missouri
– Percent of total disbursement unrepaid: 16.46%
– Unrepaid bailout amount: $272.2 million (out of $1.7 billion disbursed to Missouri)
– Per capita disbursement: $268 with $44.12 lost per capita
– Single biggest loan: $781.7 million to CitiMortgage, Inc.
You may also like: Iconic car debuts from the year you were born
Canva
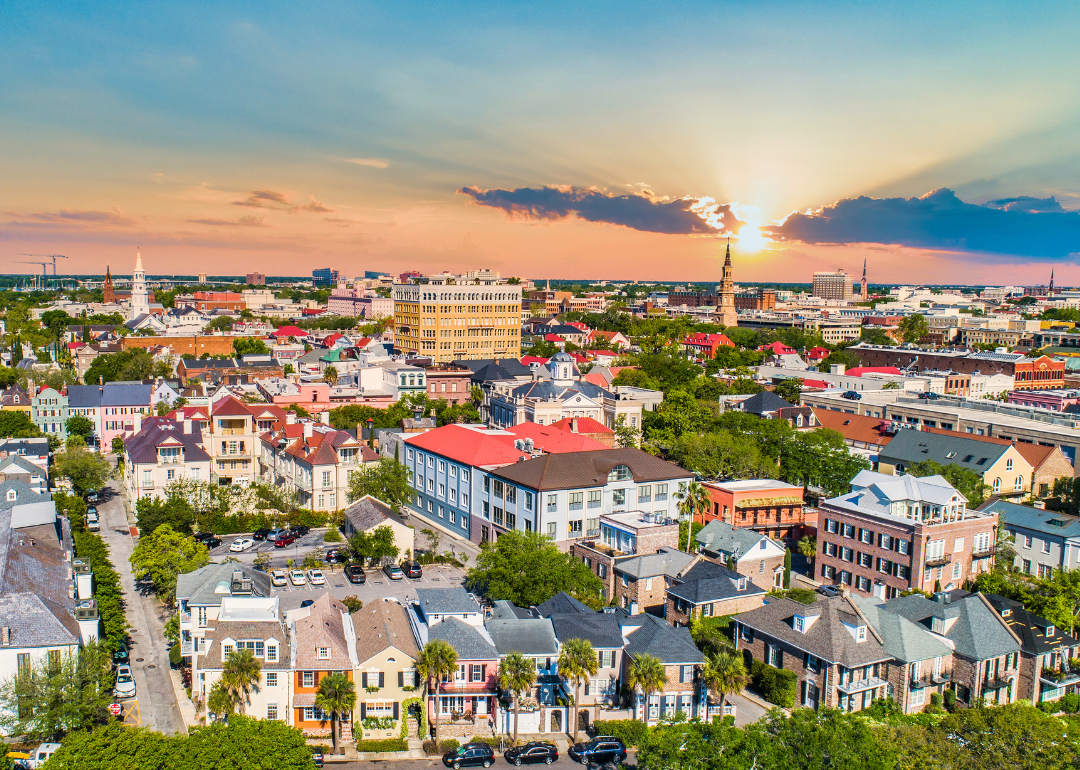
#4. South Carolina
– Percent of total disbursement unrepaid: 20.49%
– Unrepaid bailout amount: $223.7 million (out of $1.1 billion disbursed to South Carolina)
– Per capita disbursement: $210 with $43.10 lost per capita
– Single biggest loan: $347.0 million to South Financial Group
Canva
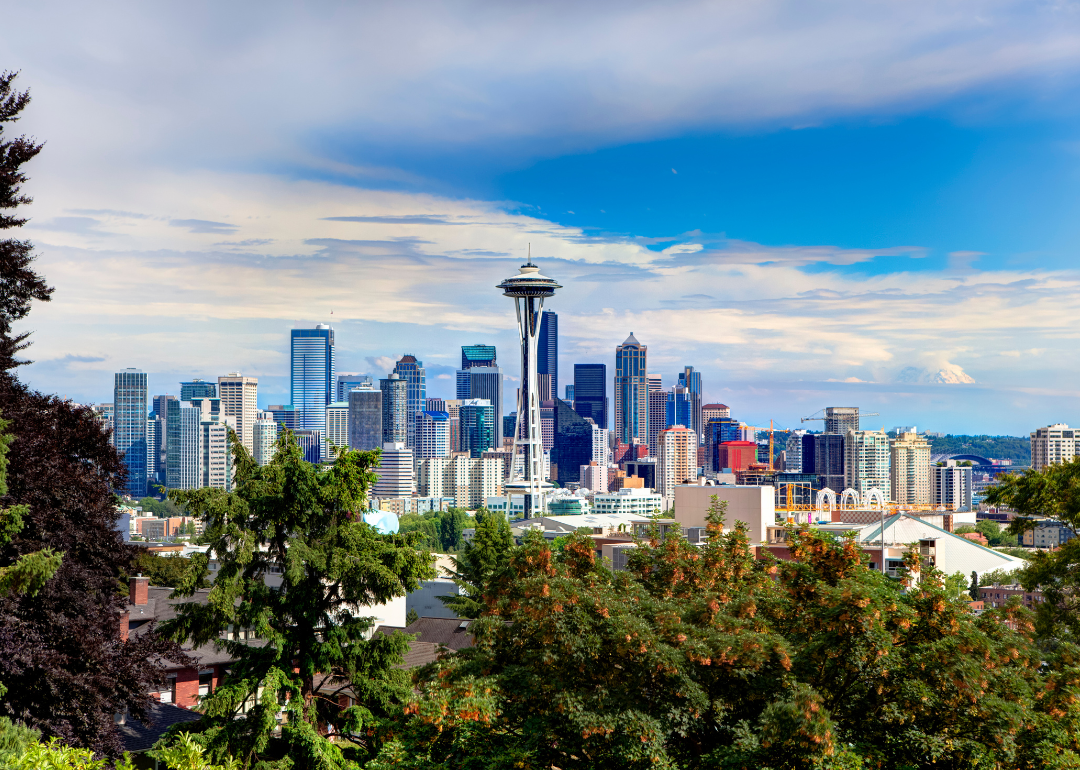
#3. Washington
– Percent of total disbursement unrepaid: 21.47%
– Unrepaid bailout amount: $212.5 million (out of $989.8 million disbursed to Washington)
– Per capita disbursement: $128 with $27.46 lost per capita
– Single biggest loan: $303.0 million to Sterling Financial Corp
Canva
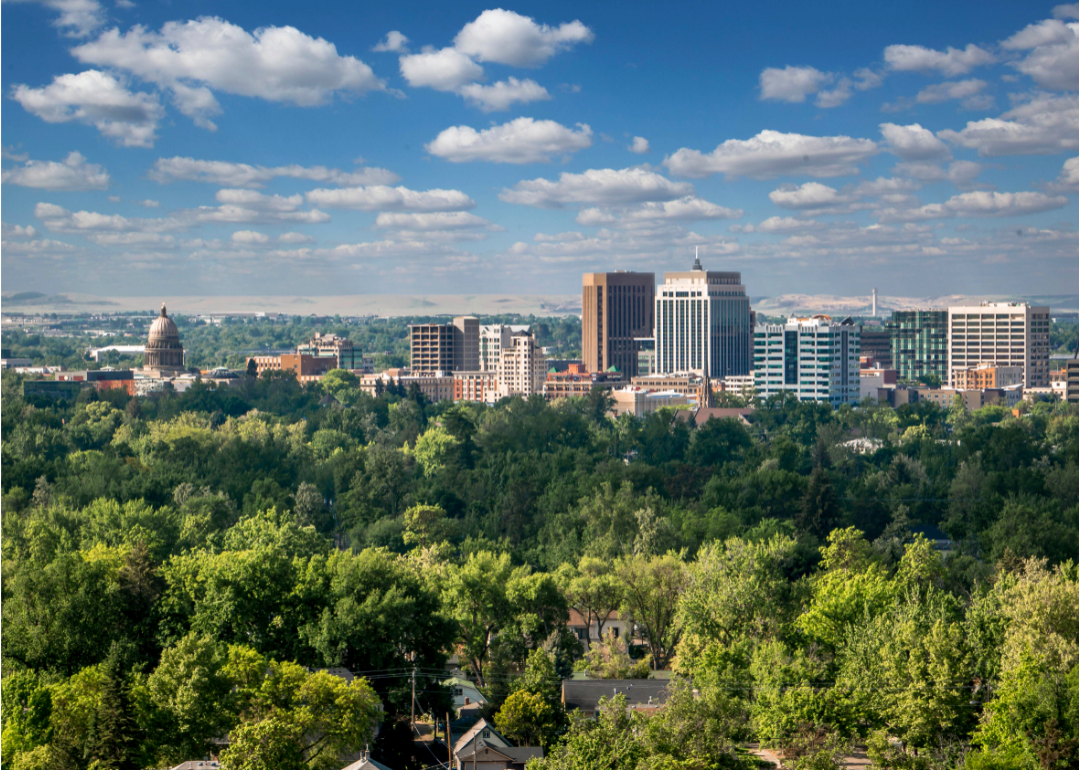
#2. Idaho
– Percent of total disbursement unrepaid: 22.69%
– Unrepaid bailout amount: $14.1 million (out of $62.1 million disbursed to Idaho)
– Per capita disbursement: $33 with $7.41 lost per capita
– Single biggest loan: $27.0 million to Intermountain Community Bancorp

Canva
#1. Hawaii
– Percent of total disbursement unrepaid: 44.10%
– Unrepaid bailout amount: $60.0 million (out of $136.0 million disbursed to Hawaii)
– Per capita disbursement: $94 with $41.60 lost per capita
– Single biggest loan: $135.0 million to Central Pacific Financial Corp

In today’s digital climate, consuming sports has never been easier. Thanks to a plethora of streaming sites, alternative broadcasts, and advancements to home entertainment systems, the average fan has myriad options to watch and learn about their favorite teams at the touch of a button—all without ever having to leave the couch.
As a result, more and more sports venues have committed to improving and modernizing their facilities and fan experiences to compete with at-home audiences. Consider using mobile ticketing and parking passes, self-service kiosks for entry and ordering food, enhanced video boards, and jumbotrons that supply data analytics and high-definition replays. These innovations and upgrades are meant to draw more revenue and attract various sponsored partners. They also deliver unique and convenient in-person experiences that rival and outmatch traditional ways of enjoying games.
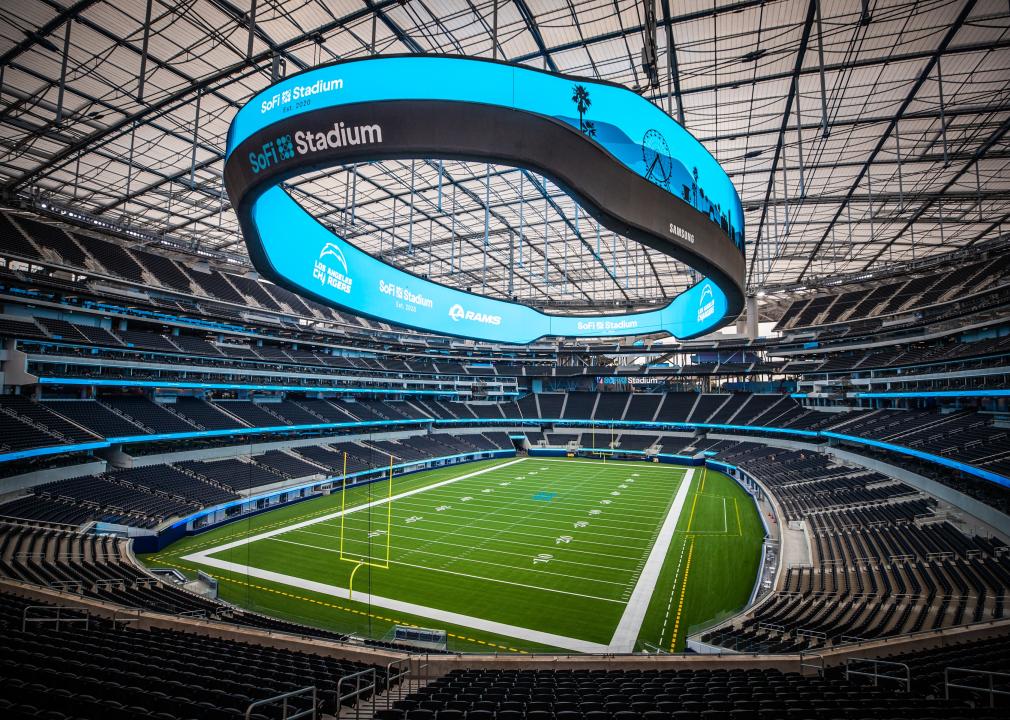
In Los Angeles, the Rams and Chargers’ SoFi Stadium has become the gold standard for football venues. It’s an architectural wonder with closer views, enhanced hospitality, and a translucent roof that cools the stadium’s internal temperature.
The Texas Rangers’ ballpark, Globe Life Field, added field-level suites and lounges that resemble the look and feel of a sports bar. Meanwhile, the Los Angeles Clippers are building a new arena (in addition to retail space, team offices, and an outdoor public plaza) that will seat 18,000 people and feature a fan section called The Wall, which will regulate attire and rooting interest.
It’s no longer acceptable to operate with old-school facilities and technology. Just look at Commanders Field (formerly FedExField), home of the Washington Commanders, which has faced criticism for its faulty barriers, leaking ceilings, poor food options, and long lines. Understandably, the team has been attempting to find a new location to build a state-of-the-art stadium and keep up with the demand for high-end amenities.
As more organizations audit their stadiums and arenas and keep up with technological innovations, Uniqode compiled a list of the latest tech advancements to coax—and keep—fans inside venues.
![]()
Jeff Gritchen/MediaNews Group/Orange County Register // Getty Images
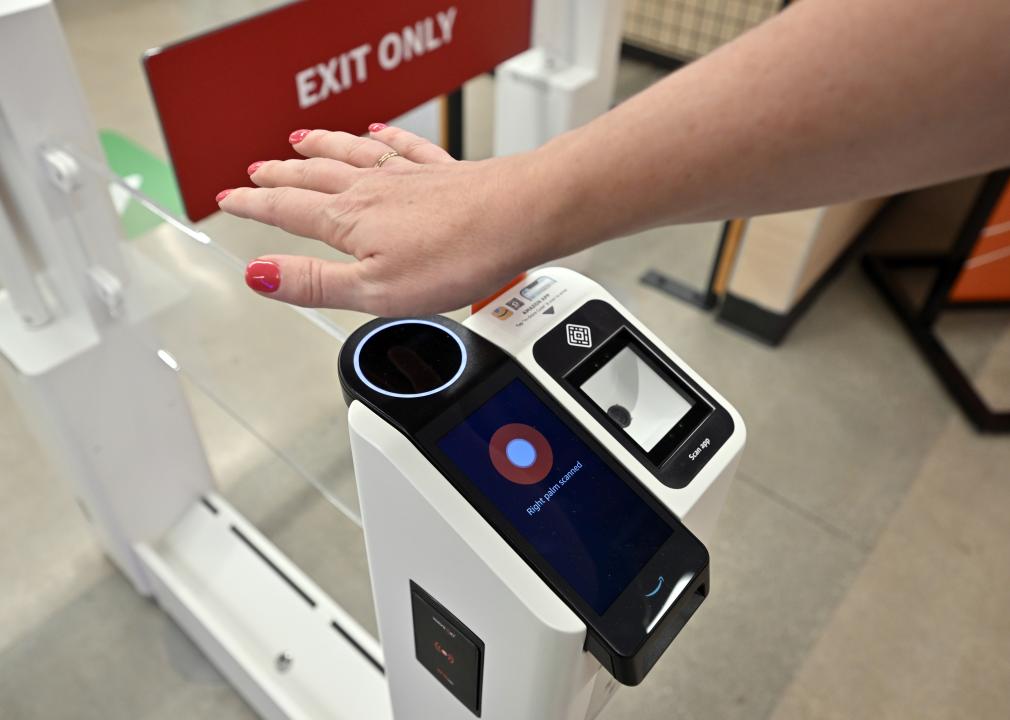
Just Walk Out technology
After successfully installing its first cashierless grocery store in 2020, Amazon has continued to put its tracking technology into practice.
In 2023, the Seahawks incorporated Just Walk Out technology at various merchandise stores throughout Lumen Field, allowing fans to purchase items with a swipe and scan of their palms.
The radio-frequency identification system, which involves overhead cameras and computer vision, is a substitute for cashiers and eliminates long lines.
RFID is now found in a handful of stadiums and arenas nationwide. These stores have already curbed checkout wait times, eliminated theft, and freed up workers to assist shoppers, according to Jon Jenkins, vice president of Just Walk Out tech.
Billie Weiss/Boston Red Sox // Getty Images
Self-serve kiosks
In the same vein as Amazon’s self-scanning technology, self-serve kiosks have become a more integrated part of professional stadiums and arenas over the last few years. Some of these function as top-tier vending machines with canned beers and nonalcoholic drinks, shuffling lines quicker with virtual bartenders capable of spinning cocktails and mixed drinks.
The kiosks extend past beverages, as many college and professional venues have started using them to scan printed and digital tickets for more efficient entrance. It’s an effort to cut down lines and limit the more tedious aspects of in-person attendance, and it’s led various competing kiosk brands to provide their specific conveniences.

Kyle Rivas // Getty Images
Mobile ordering
Is there anything worse than navigating the concourse for food and alcohol and subsequently missing a go-ahead home run, clutch double play, or diving catch?
Within the last few years, more stadiums have eliminated those worries thanks to contactless mobile ordering. Fans can select food and drink items online on their phones to be delivered right to their seats. Nearly half of consumers said mobile app ordering would influence them to make more restaurant purchases, according to a 2020 study at PYMNTS. Another study showed a 22% increase in order size.
Many venues, including Yankee Stadium, have taken notice and now offer personalized deliveries in certain sections and established mobile order pick-up zones throughout the ballpark.
Darrian Traynor // Getty Images
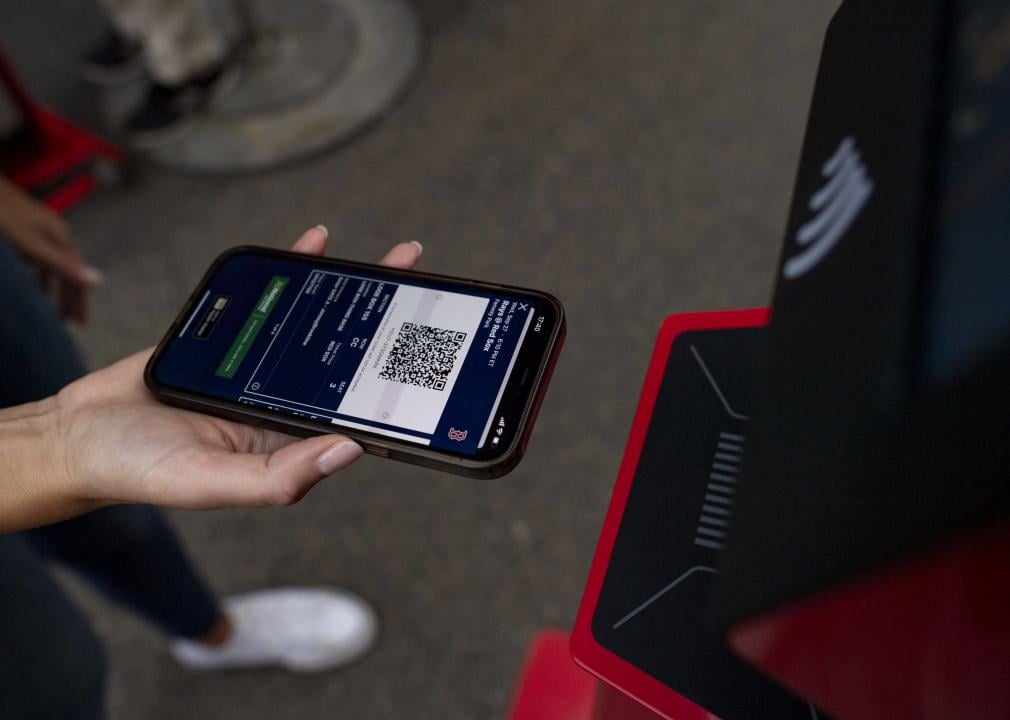
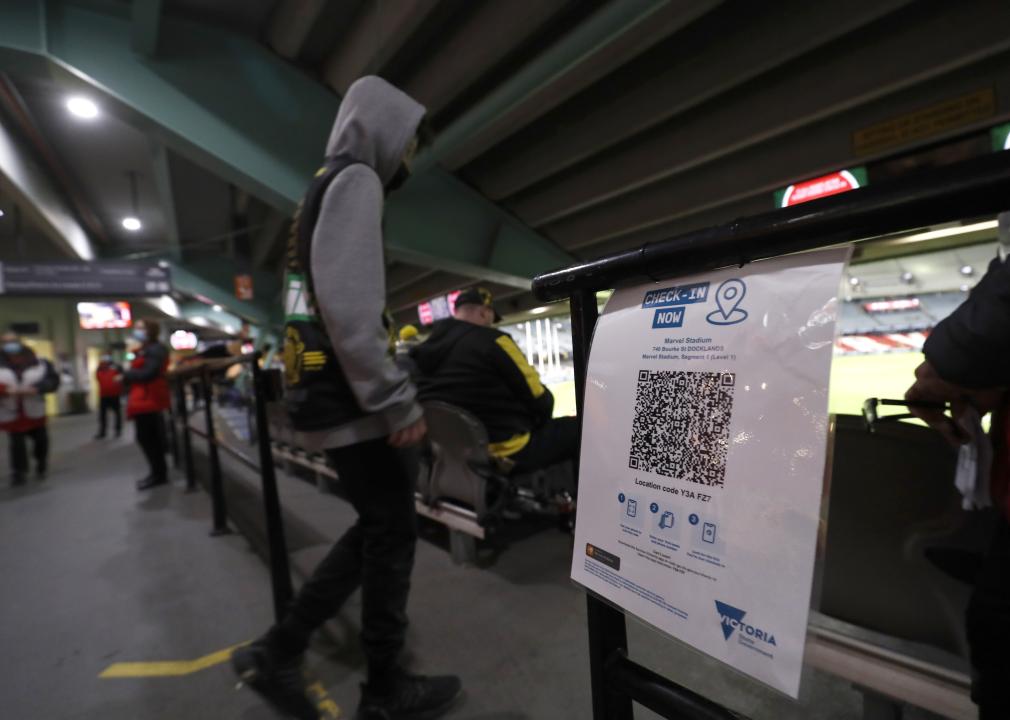
QR codes at seats
Need to remember a player’s name? Want to look up an opponent’s statistics at halftime? The team at Digital Seat Media has you covered.
Thus far, the company has added seat tags to more than 50 venues—including two NFL stadiums—with QR codes to promote more engagement with the product on the field. After scanning the code, fans can access augmented reality features, look up rosters and scores, participate in sponsorship integrations, and answer fan polls on the mobile platform.

Boris Streubel/Getty Images for DFL // Getty Images
Real-time data analytics and generative AI
As more venues look to reinvigorate the in-stadium experience, some have started using generative artificial intelligence and real-time data analytics. Though not used widely yet, generative AI tools can create new content—text, imagery, or music—in conjunction with the game, providing updates, instant replays, and location-based dining suggestions
Last year, the Masters golf tournament even began including AI score projections in its mobile app. Real-time data is streamlining various stadium pitfalls, allowing operation managers to monitor staffing issues at busy food spots, adjust parking flows, and alert custodians to dirty or damaged bathrooms. The data also helps with security measures. Open up an app at a venue like the Honda Center in Anaheim, California, and report safety issues or belligerent fans to help better target disruptions and preserve an enjoyable experience.
Story editing by Nicole Caldwell. Copy editing by Paris Close. Photo selection by Lacy Kerrick.
This story originally appeared on Uniqode and was produced and
distributed in partnership with Stacker Studio.

Inflation has cooled substantially, but Americans are still feeling the strain of sky-high prices. Consumers have to spend more on the same products, from the grocery store to the gas pump, than ever before.
Increased import costs are part of the problem. The U.S. is the largest goods importer in the world, bringing in $3.2 trillion in 2022. Import costs rose dramatically in 2021 and 2022 due to shipping constraints, world events, and other supply chain interruptions and cost pressures. At the June 2022 peak, import costs for all commodities were up 18.6% compared to January 2020.
While import costs have since fallen most months—helping to lower inflation—they remain nearly 12% above what they were in 2020. And beginning in 2024, import costs began to rise again, with January seeing the highest one-month increase since March 2022.
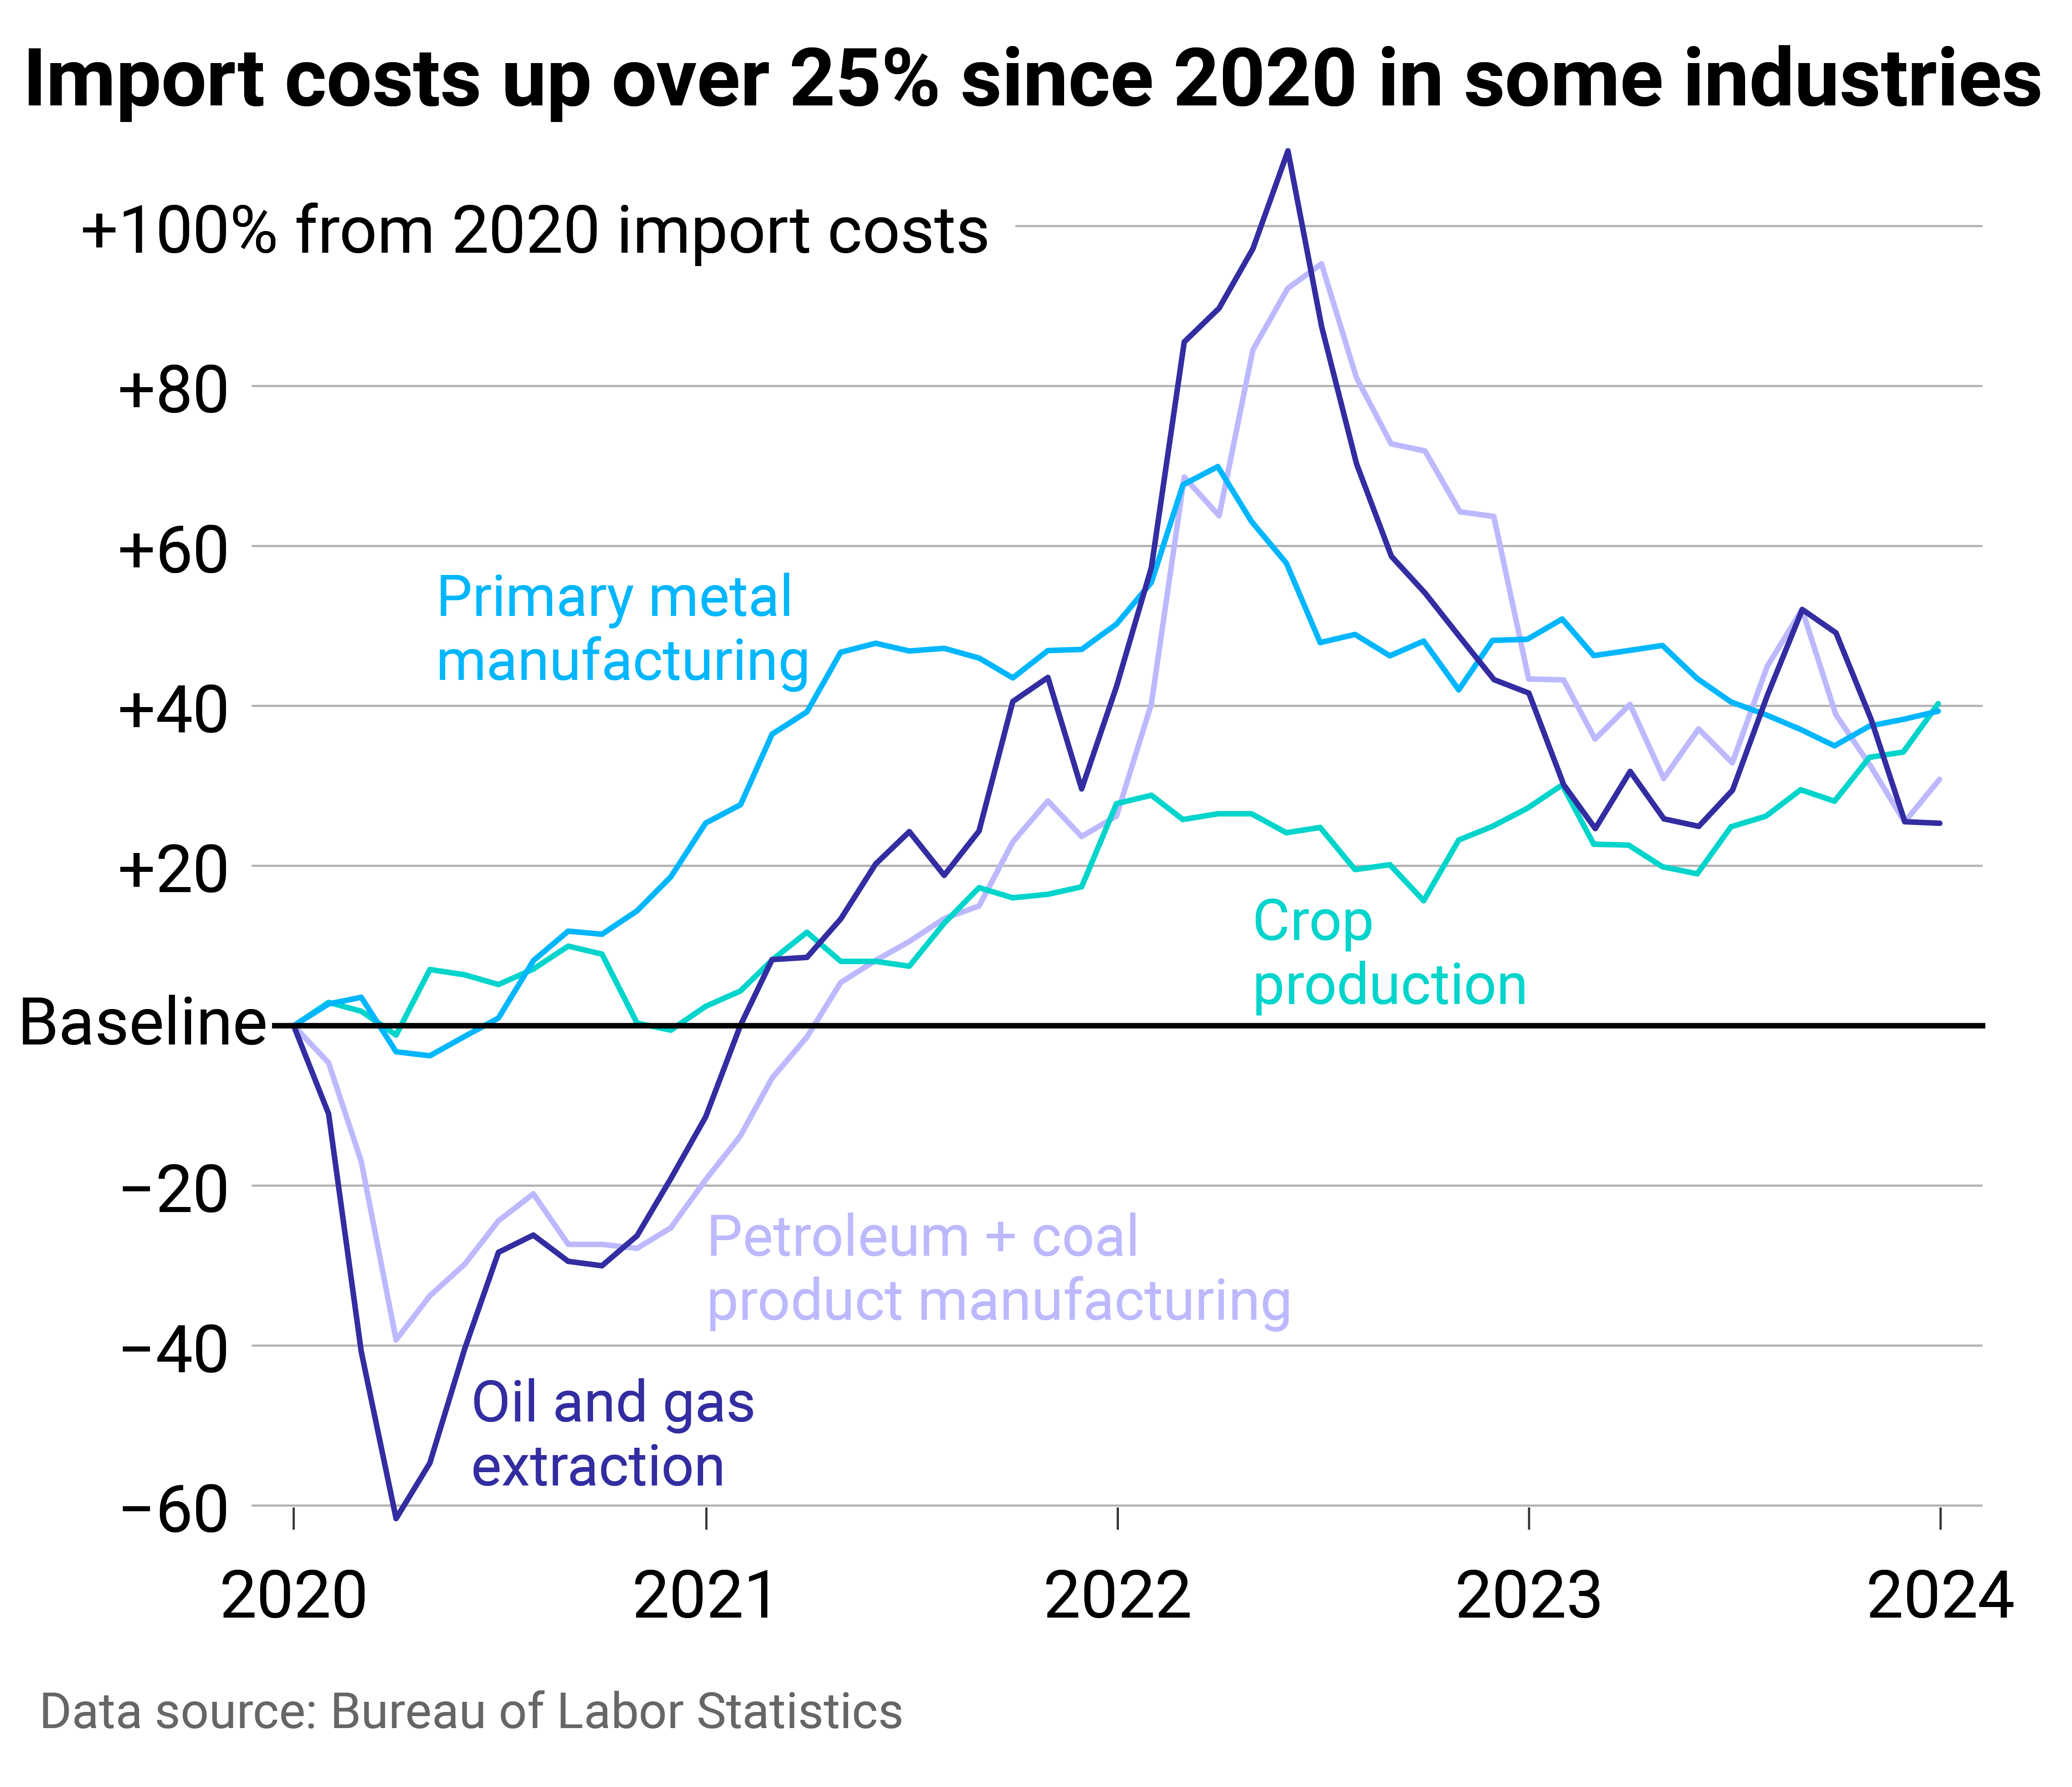
Machinery Partner used Bureau of Labor Statistics data to identify the soaring import costs that have translated to higher costs for Americans. Imports in a few industries have had an outsized impact, helping drive some of the overall spikes. Crop production, primary metal manufacturing, petroleum and coal product manufacturing, and oil and gas extraction were the worst offenders, with costs for each industry remaining at least 20% above 2020.
![]()
Machinery Partner
Imports related to crops, oil, and metals are keeping costs up
At the mid-2022 peak, import costs related to oil, gas, petroleum, and coal products had the highest increases, doubling their pre-pandemic costs. Oil prices went up globally as leaders anticipated supply disruptions from the conflict in Ukraine. The U.S. and other allied countries put limits on Russian revenues from oil sales through a price cap of oil, gas, and coal from the country, which was enacted in 2022.
This activity around the world’s second-largest oil producer pushed prices up throughout the market and intensified fluctuations in crude oil prices. Previously, the U.S. had imported hundreds of thousands of oil barrels from Russia per day, making the country a leading source of U.S. oil. In turn, the ban affected costs in the U.S. beyond what occurred in the global economy.
Americans felt this at the pump—with gasoline prices surging 60% for consumers year-over-year in June 2022 and remaining elevated to this day—but also throughout the economy, as the entire supply chain has dealt with higher gas, oil, and coal prices.
Some of the pressure from petroleum and oil has shifted to new industries: crop production and primary metal manufacturing. In each of these sectors, import costs in January were up about 40% from 2020.
Primary metal manufacturing experienced record import price growth in 2021, which continued into early 2022. The subsequent monthly and yearly drops have not been substantial enough to bring costs down to pre-COVID levels. Bureau of Labor Statistics reporting shows that increasing alumina and aluminum production prices had the most significant influence on primary metal import prices. Aluminum is widely used in consumer products, from cars and parts to canned beverages, which in turn inflated rapidly.
Aluminum was in short supply in early 2022 after high energy costs—i.e., gas—led to production cuts in Europe, driving aluminum prices to a 13-year high. The U.S. also imposes tariffs on aluminum imports, which were implemented in 2018 to cut down on overcapacity and promote U.S. aluminum production. Suppliers, including Canada, Mexico, and European Union countries, have exemptions, but the tax still adds cost to imports.
U.S. agricultural imports have expanded in recent decades, with most products coming from Canada, Mexico, the EU, and South America. Common agricultural imports include fruits and vegetables—especially those that are tropical or out-of-season—as well as nuts, coffee, spices, and beverages. Turmoil with Russia was again a large contributor to cost increases in agricultural trade, alongside extreme weather events and disruptions in the supply chain. Americans felt these price hikes directly at the grocery store.
The U.S. imports significantly more than it exports, and added costs to those imports are felt far beyond its ports. If import prices continue to rise, overall inflation would likely follow, pushing already high prices even further for American consumers.
Story editing by Shannon Luders-Manuel. Copy editing by Kristen Wegrzyn.
This story originally appeared on Machinery Partner and was produced and
distributed in partnership with Stacker Studio.

Nearly every state requires drivers to carry car insurance, but the laws vary, and many factors affect the cost of coverage.
Some are controllable, at least to degrees: the type of car you have and your credit history. Some are not: your age and gender. Your marital status, place of residence, and claims history are among the other variables that go into it.
Across the United States, premiums are soaring, rising 20% year over year and increasing six times faster than consumer prices overall as of December 2023, CBS reported. Last September, CNN noted that car insurance rates jumped more in the previous year than they had since 1976.
CBS pointed to many potential reasons for these increases in prices. Coronavirus pandemic-era issues have made buying, fixing, and replacing vehicles costlier. Extreme weather events caused by climate change also damage more vehicles, while insurance companies are increasing their business costs. Severe and more frequent crashes are to blame as well, CNN reported.
On top of these, local factors such as population density, the number of uninsured drivers, and the frequency of insurance claims all affect premiums, which can lead motorists to change or switch their coverage, use other modes of transportation, or even alter decisions about when to buy a vehicle or what to look for.
To see how geography affects cost, Cheap Insurance mapped the states where people pay the most in car insurance premiums using MarketWatch data. Premium estimates were based on full-coverage car insurance for a 35-year-old driver with good credit and a clean driving record. Data accurate as of February 2024.
![]()
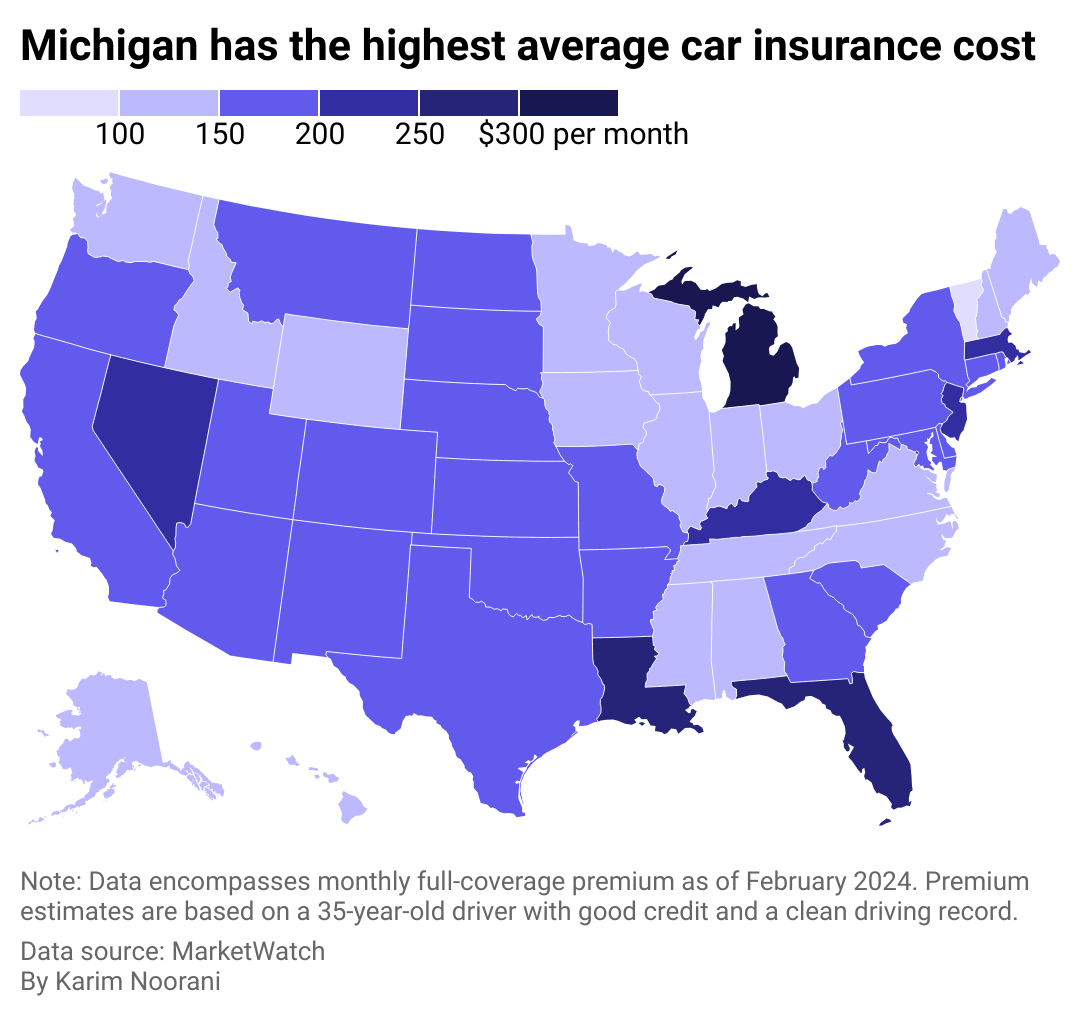
Cheap Insurance
Americans pay $167 per month on average for full-coverage insurance
There are common denominators among the five states where it’s most expensive to have car insurance: Michigan, Florida, Louisiana, Nevada, and Kentucky. Washington D.C. is another pricey locale, ranking #4 overall.
Three of these six are no-fault jurisdictions and require additional coverage beyond coverage to pay for medical costs. Michigan notably calls for $250,000 in personal injury protection (though people with Medicaid and Medicare may qualify for lower limits), $1 million in personal property insurance for damage done by your car in Michigan, and residual bodily injury and property damage liability that starts at $250,000 for a person harmed in an accident.
Other commonalities between these states include high urban population densities. At least 9 in 10 people in Nevada, Florida, and Washington D.C. live in cities and urban areas, which leads to more crashes and thefts and high rates of uninsured drivers and lawsuits. Additionally, Louisiana, Florida, and Kentucky rank #5, #8, and #10, respectively, in motor vehicle crash deaths per 100 million vehicle miles traveled in 2021 based on Department of Transportation data analyzed by the Insurance Institute for Highway Safety.

Canva
#5. Kentucky
– Monthly full-coverage insurance: $210
– Monthly liability insurance: $57

Canva
#4. Nevada
– Monthly full-coverage insurance: $232
– Monthly liability insurance: $107
Canva
#3. Louisiana
– Monthly full-coverage insurance: $253
– Monthly liability insurance: $77
Canva
#2. Florida
– Monthly full-coverage insurance: $270
– Monthly liability insurance: $115

Canva
#1. Michigan
– Monthly full-coverage insurance: $304
– Monthly liability insurance: $113
Story editing by Carren Jao. Copy editing by Paris Close. Photo selection by Lacy Kerrick.
This story originally appeared on Cheap Insurance and was produced and
distributed in partnership with Stacker Studio.
-

 Business4 months ago
mesh conference goes deep on AI, with experts focusing in on training, ethics, and risk
-

 Business4 months ago
Skill-based hiring is the answer to labour shortages, BCG report finds
-

 Events6 months ago
Top 5 tech and digital transformation events to wrap up 2023
-

 People4 months ago
How connected technologies trim rework and boost worker safety in hands-on industries
-

 Events3 months ago
The Northern Lights Technology & Innovation Forum comes to Calgary next month