
Business
5 charts that show the growth of retail e-commerce in the 21st century

The volume of online shopping done by Americans has skyrocketed in recent years, fueled by a global pandemic and technological advancements. But it hasn’t always looked this way for the e-commerce sector.
Online retail is actually a relatively new form of doing business and the Census Bureau only began tracking the industry segment in a standardized format this year.
The first true e-commerce company goes back to 1969, but it looked a lot different than the click-to-buy, frictionless convenience we know today. Named CompuServe, the company was the oldest of the early internet service providers (another was America Online, which acquired CompuServe in 1998). Through the ’80s and ’90s, CompuServe provided dial-up internet service along with software, games, and a chat service to customers for a fee of around $9 per month (or about $20 per month in today’s dollars).
By the summer of 1995, Jeff Bezos had launched a service for buying books over the internet. In its first 30 days of operation, the company made sales in 50 states and 45 countries. And thus, Amazon was born. That same year an online auction site named eBay was founded and became almost immediately profitable.
CompuServe required a manual that could be purchased separately to get the most out of the service. But with Amazon and a new generation of emerging e-commerce platforms in the ’90s, the new technology ushered in convenience and user-friendliness to spur adoption.
Now, online shopping is as simple as a few taps on a smartphone, and it represents 14.5% of all retail sales. E-commerce retail sales hit about $960 billion in the U.S. in 2021 and this year, Americans are on track to exceed that with nearly $508 billion in sales through Q2 alone, according to U.S. Census Bureau data. American shoppers spend an estimated $2.85 billion online collectively each day.
To gain more insight into this online evolution, Ironplane compiled data from Census Bureau’s Annual Retail Trade Survey (ARTS) and the Quarterly E-Commerce Report subset to showcase how e-commerce has grown over the past two decades. (As a survey, all numbers provided by ARTS have a margin of sampling error.) Read on to learn how the evolution of the internet has changed the way humans shop.
![]()
Ironplane
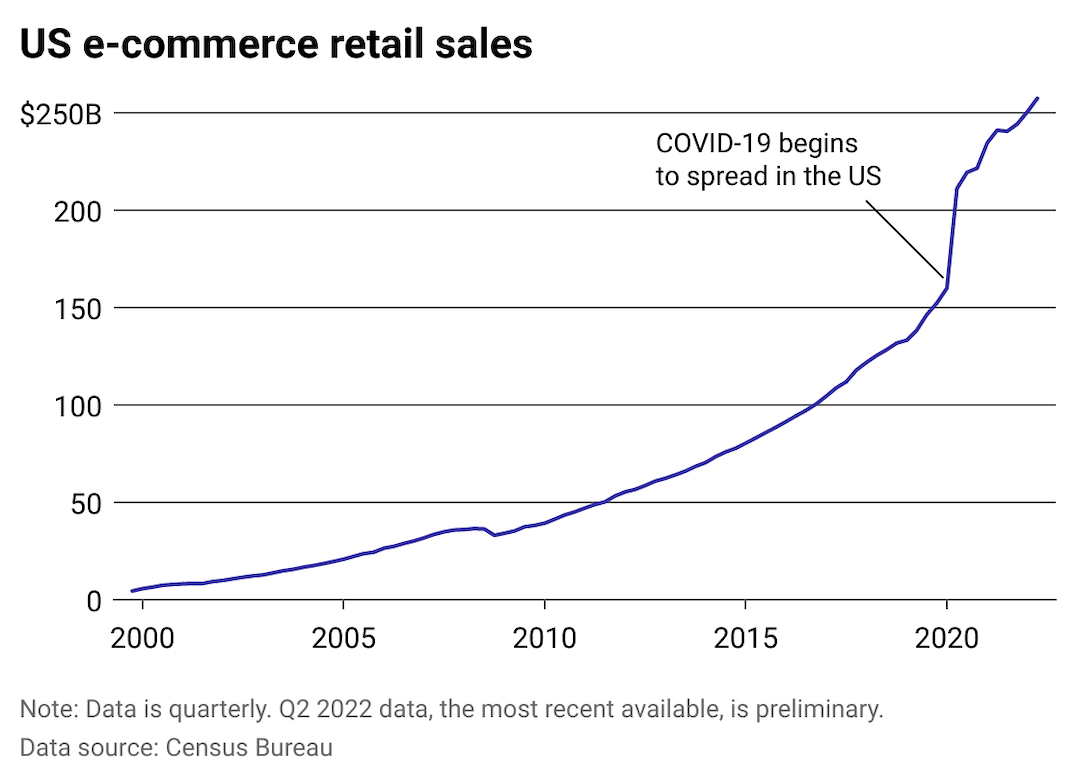
E-commerce retail had been increasing steadily prior to 2020
Before people headed online en masse due to social distancing and public health concerns, e-commerce had already been experiencing rising sales. In the early 2000s, a flurry of traditional retail giants—including Walmart, Costco, and Safeway—launched websites for online sales, spurred by a healthy fear of Amazon’s early dominance. And despite a dip in sales during the Great Recession, e-commerce activity increased each year at a relatively steady pace.
Throughout the 2010s, retailers pared down brick-and-mortar store locations while investing in fulfillment services and acquiring tech platforms to support e-commerce operations. In 2013, office supplies retailer Staples, for example, saw in-store shopping habits shift online to such an extent that its executives buckled down to “fundamentally reinvent” the company. This plan included shuttering hundreds of store locations.
Ironplane
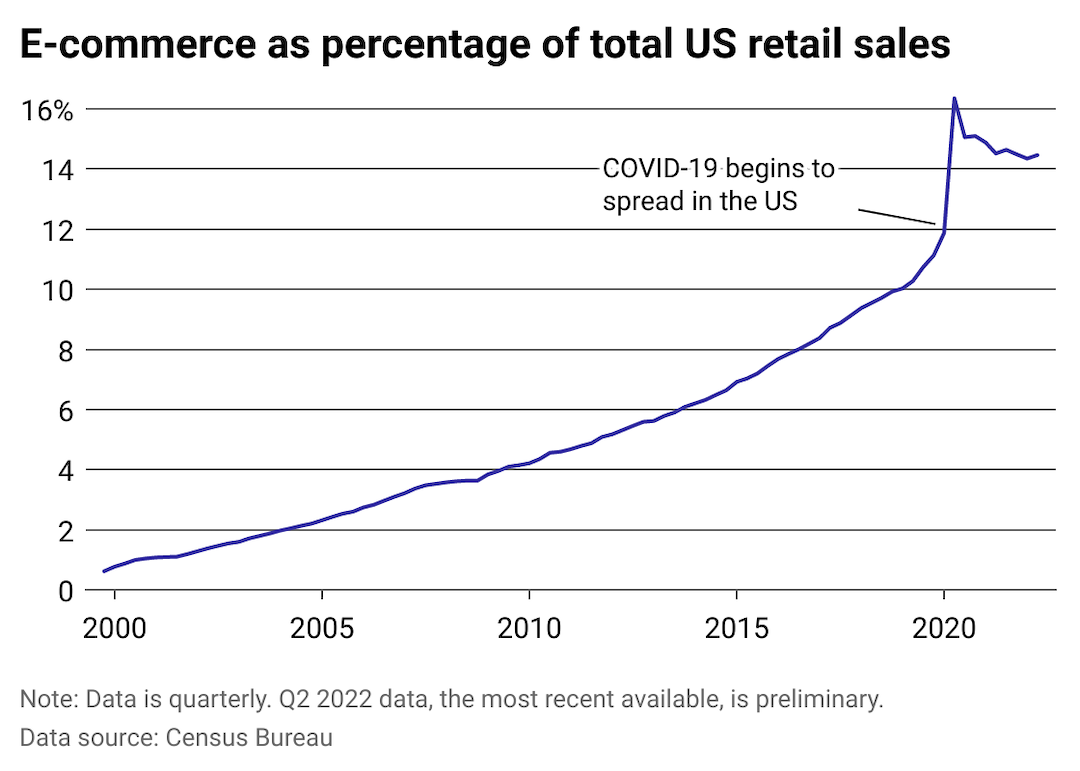
E-commerce saw a sharp rise after the onset of the pandemic—followed by a drop
Roughly 3 in 20 retail purchases made in the U.S. are online. And for much of the last two decades, online shopping has seen its share of the market grow steadily. Until the pandemic arrived, that is.
The onset of the COVID-19 pandemic caused Americans to desert public spaces—an act that supercharged online shopping in 2020. While some retail executives and industry analysts predicted that the trend toward online shopping was here to stay, online sales began to dip by fall 2020, showing that the trend wasn’t as sticky as they may have believed. E-commerce’s portion of market share has dropped, though it’s still slightly higher than before the pandemic.
Ironplane
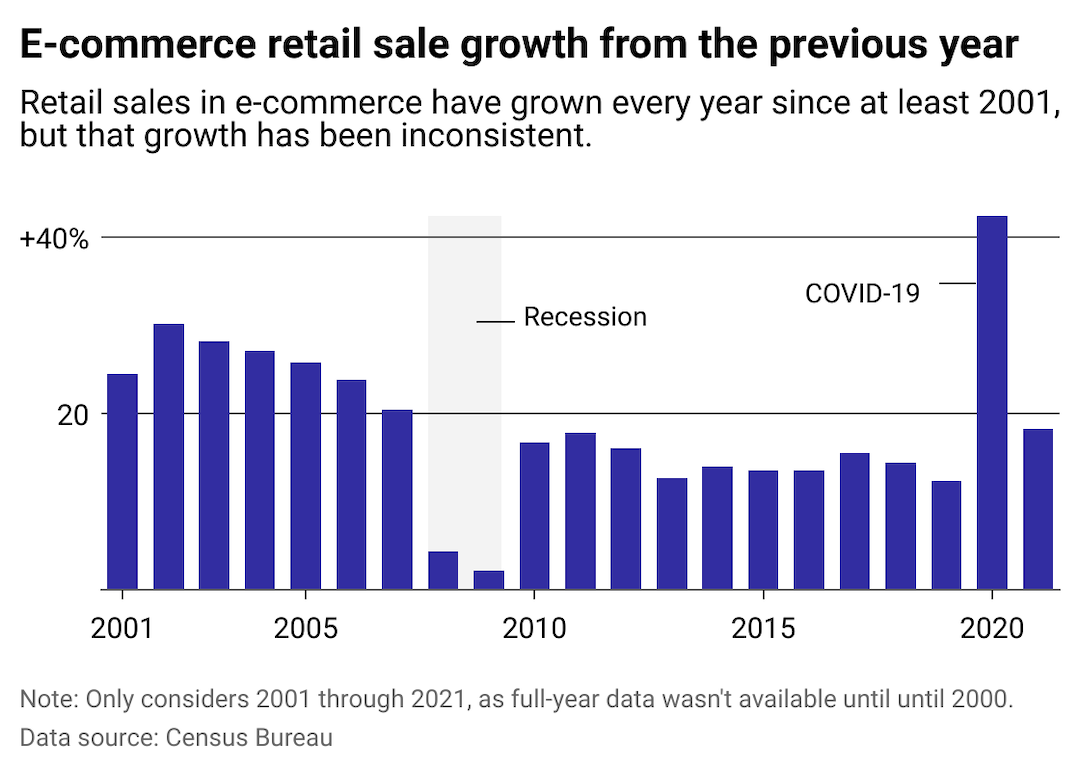
Biggest annual gains for retail e-commerce occurred in 2020 and years following the dot-com boom
The first ever “Cyber Monday,” the online shopping holiday that falls the Monday after Thanksgiving, happened in 2005. But even the widespread popularity of the new holiday couldn’t match the boost the COVID-19 pandemic provided to e-commerce shopping growth when measured yearly. Growth tapered during the Great Recession as American households pulled back on spending, and began to recover in the 2010s, though it did not reach early industry growth levels until 2020.
Ironplane
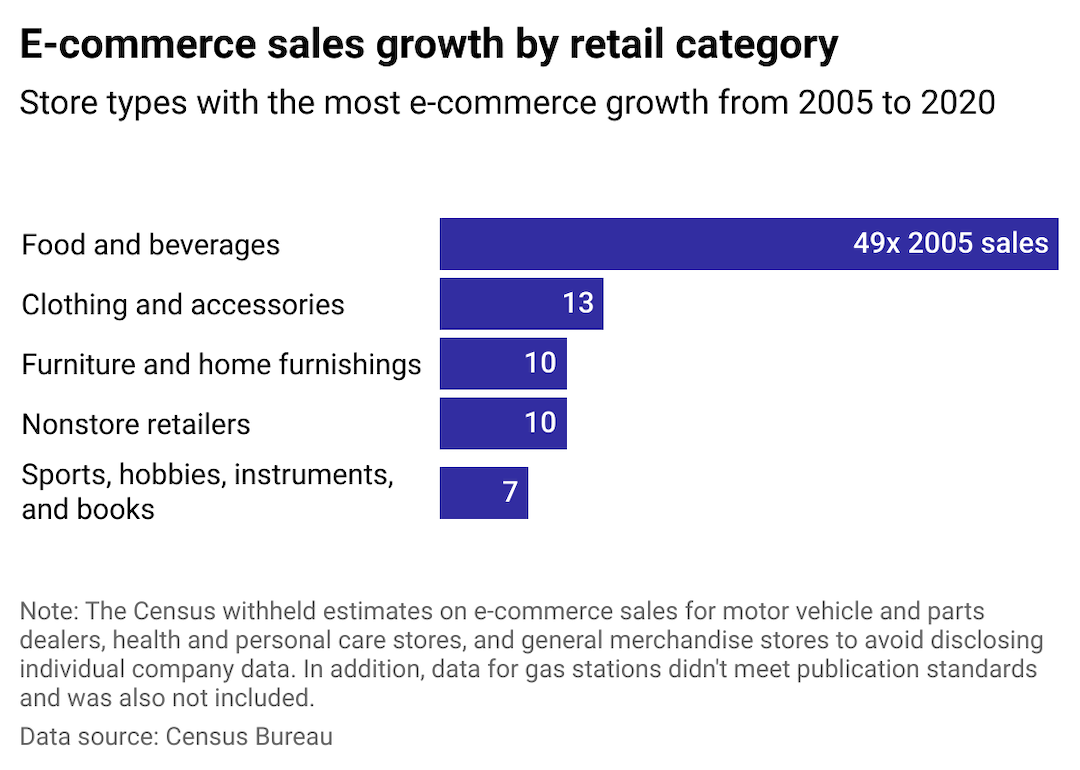
Food and beverage stores have seen the largest growth in e-commerce
Online food and beverage sales, including grocery and restaurant delivery, have been the fastest-growing segment of ecommerce sales since 2005. Americans dropped $23 billion collectively on grocery and food delivery in 2020, up from $8.5 billion in 2019. Clothing and wearable accessories saw the next largest boost in 2020, bringing in $16 billion—up from $12.5 the previous year.
Ironplane
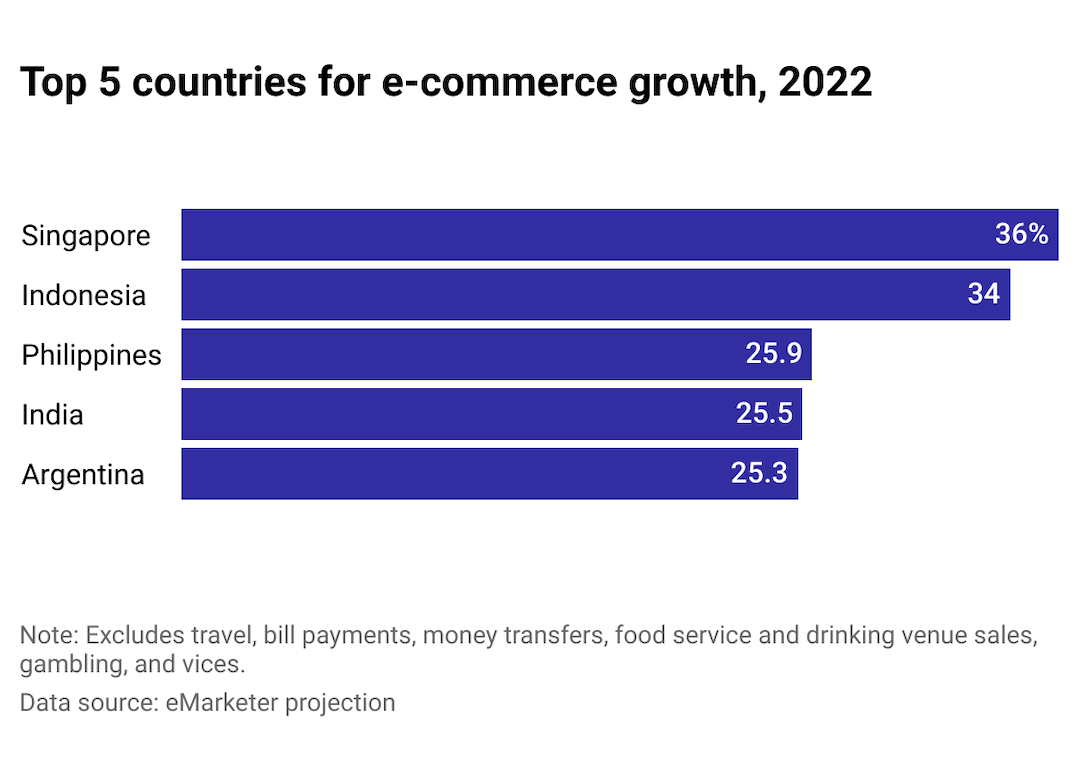
Here’s where e-commerce is projected to grow fastest this year
With the combination of booming populations and the growing availability of internet-connected devices, the countries poised to see the most growth this year are Singapore, Indonesia, the Philippines, as well as India and Argentina.
According to eMarketer, Asian countries began to surpass the U.S. in 2016 for e-commerce growth, when China became the largest market for online shopping in the world. The research firm estimates that e-commerce sales will grow worldwide by 9.7% this year.
This story originally appeared on Ironplane and was produced and
distributed in partnership with Stacker Studio.


Inflation has cooled substantially, but Americans are still feeling the strain of sky-high prices. Consumers have to spend more on the same products, from the grocery store to the gas pump, than ever before.
Increased import costs are part of the problem. The U.S. is the largest goods importer in the world, bringing in $3.2 trillion in 2022. Import costs rose dramatically in 2021 and 2022 due to shipping constraints, world events, and other supply chain interruptions and cost pressures. At the June 2022 peak, import costs for all commodities were up 18.6% compared to January 2020.
While import costs have since fallen most months—helping to lower inflation—they remain nearly 12% above what they were in 2020. And beginning in 2024, import costs began to rise again, with January seeing the highest one-month increase since March 2022.
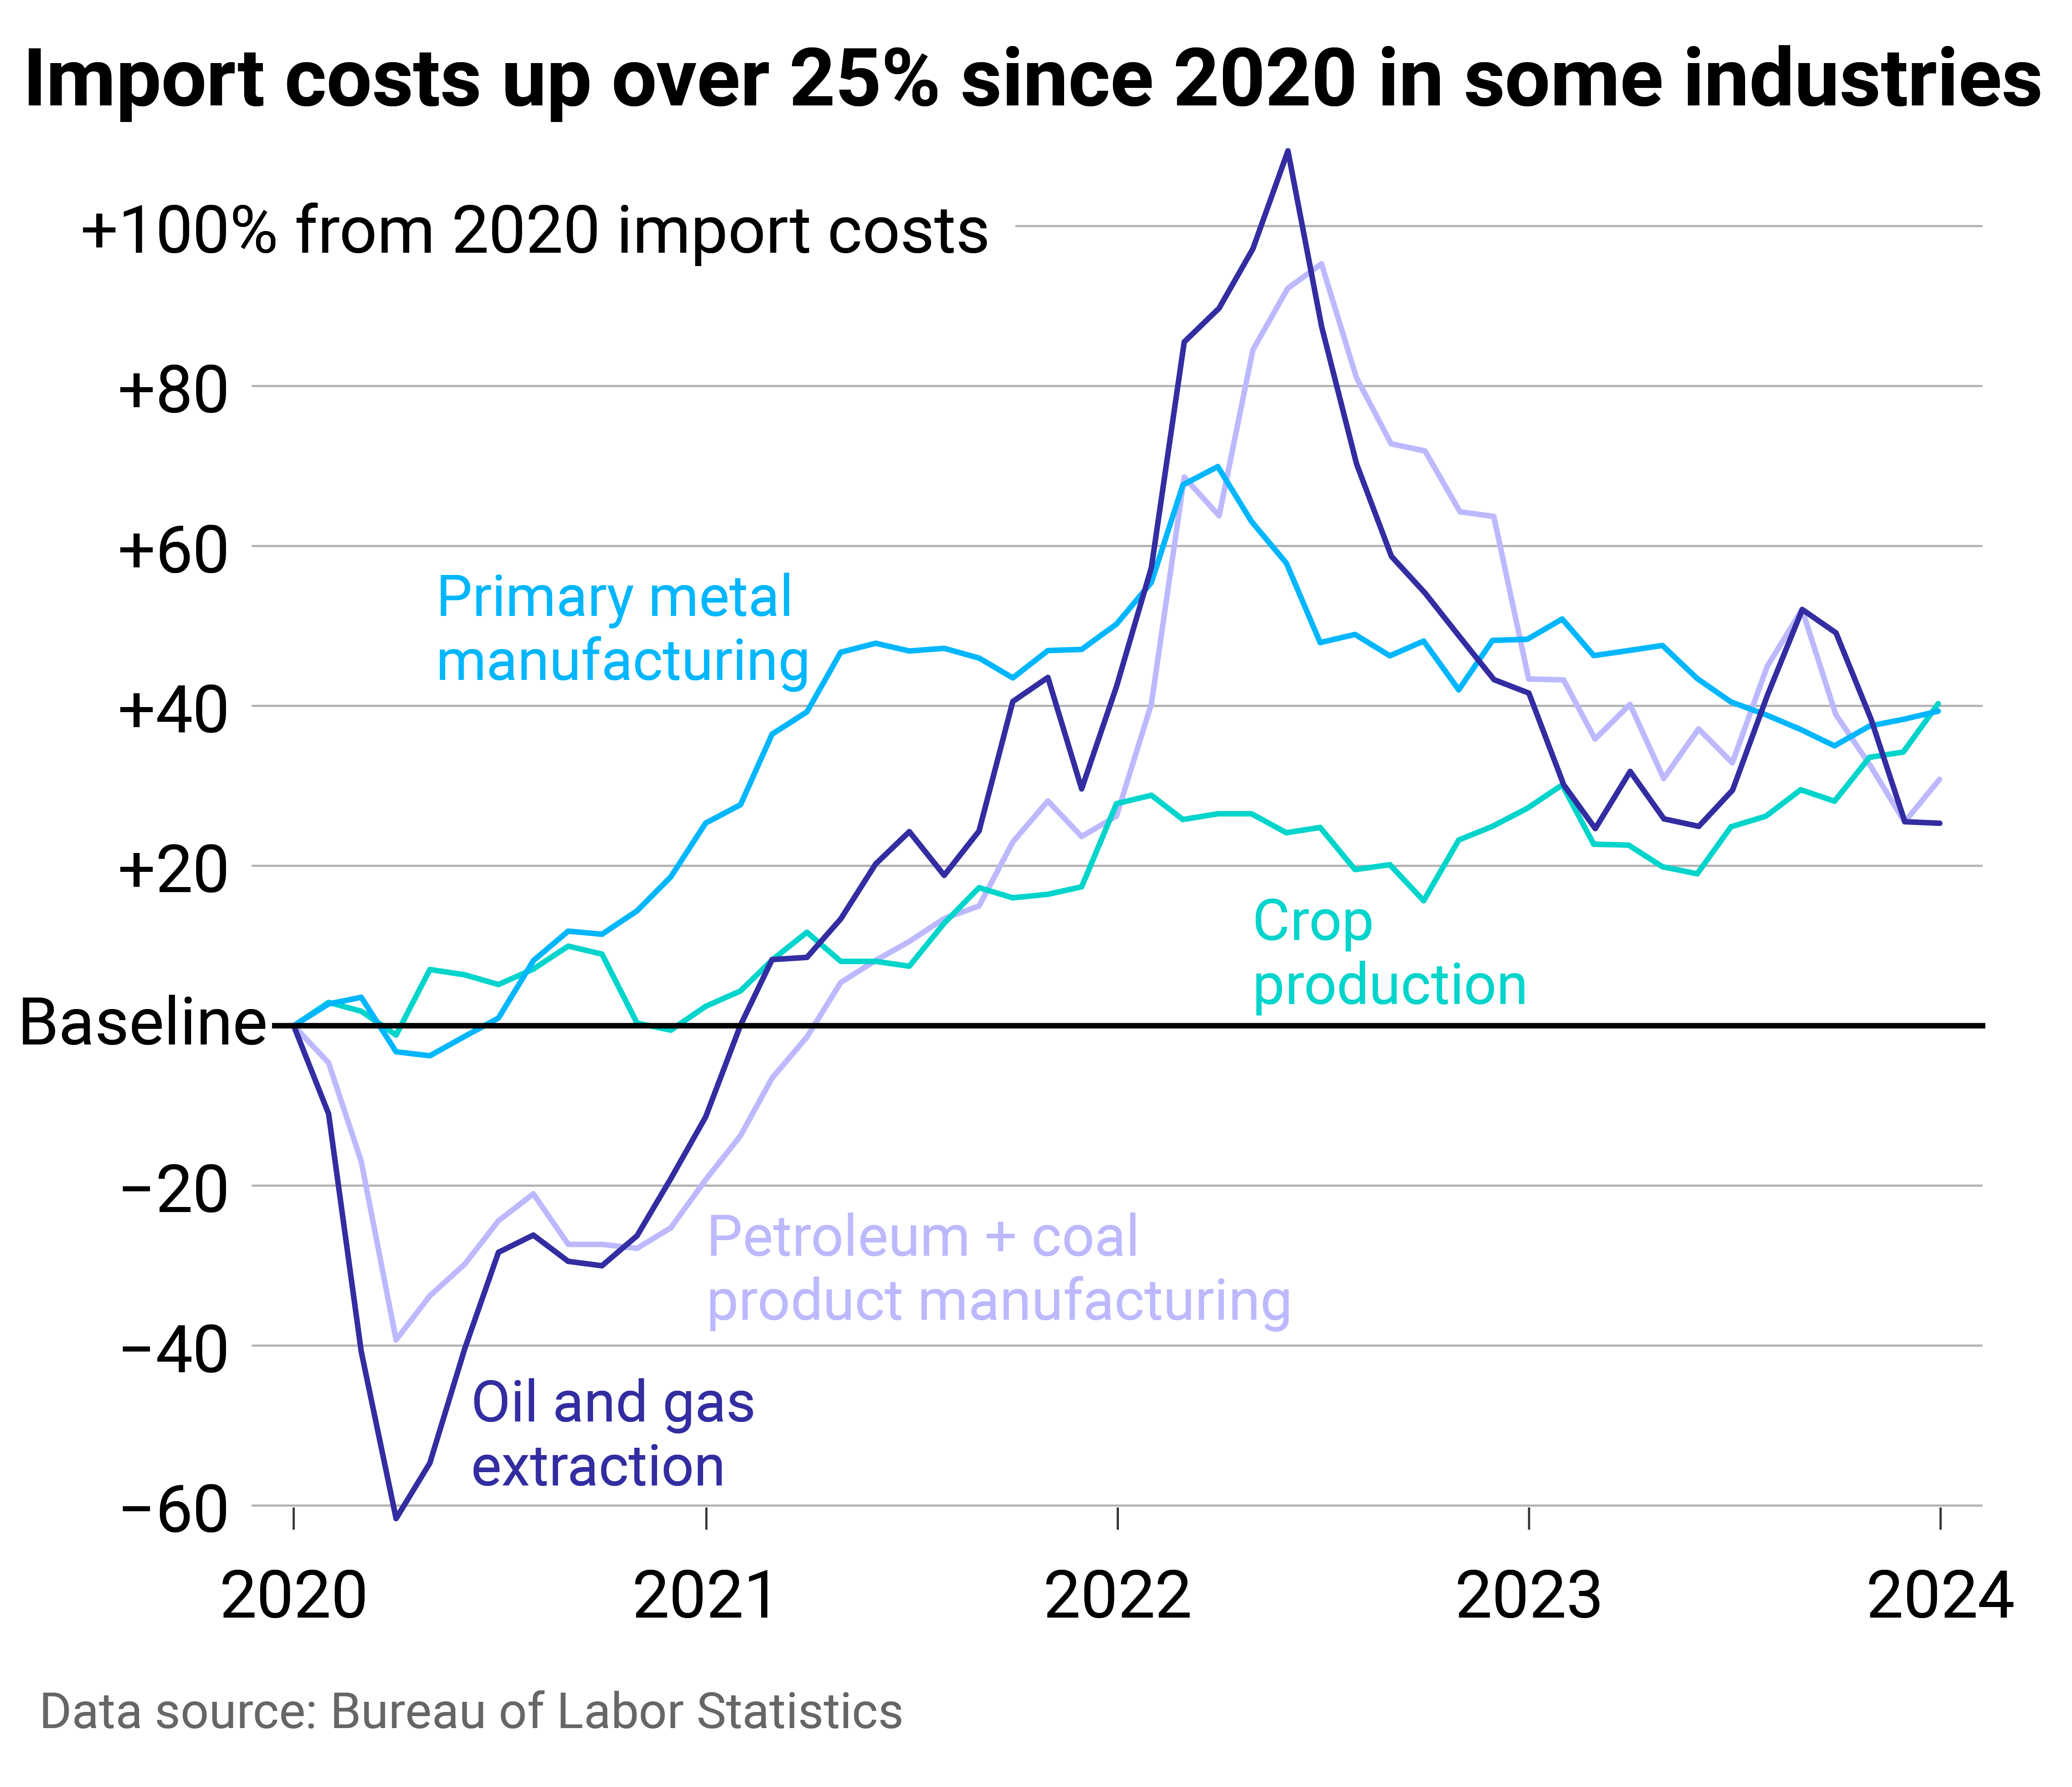
Machinery Partner used Bureau of Labor Statistics data to identify the soaring import costs that have translated to higher costs for Americans. Imports in a few industries have had an outsized impact, helping drive some of the overall spikes. Crop production, primary metal manufacturing, petroleum and coal product manufacturing, and oil and gas extraction were the worst offenders, with costs for each industry remaining at least 20% above 2020.
![]()
Machinery Partner
Imports related to crops, oil, and metals are keeping costs up
At the mid-2022 peak, import costs related to oil, gas, petroleum, and coal products had the highest increases, doubling their pre-pandemic costs. Oil prices went up globally as leaders anticipated supply disruptions from the conflict in Ukraine. The U.S. and other allied countries put limits on Russian revenues from oil sales through a price cap of oil, gas, and coal from the country, which was enacted in 2022.
This activity around the world’s second-largest oil producer pushed prices up throughout the market and intensified fluctuations in crude oil prices. Previously, the U.S. had imported hundreds of thousands of oil barrels from Russia per day, making the country a leading source of U.S. oil. In turn, the ban affected costs in the U.S. beyond what occurred in the global economy.
Americans felt this at the pump—with gasoline prices surging 60% for consumers year-over-year in June 2022 and remaining elevated to this day—but also throughout the economy, as the entire supply chain has dealt with higher gas, oil, and coal prices.
Some of the pressure from petroleum and oil has shifted to new industries: crop production and primary metal manufacturing. In each of these sectors, import costs in January were up about 40% from 2020.
Primary metal manufacturing experienced record import price growth in 2021, which continued into early 2022. The subsequent monthly and yearly drops have not been substantial enough to bring costs down to pre-COVID levels. Bureau of Labor Statistics reporting shows that increasing alumina and aluminum production prices had the most significant influence on primary metal import prices. Aluminum is widely used in consumer products, from cars and parts to canned beverages, which in turn inflated rapidly.
Aluminum was in short supply in early 2022 after high energy costs—i.e., gas—led to production cuts in Europe, driving aluminum prices to a 13-year high. The U.S. also imposes tariffs on aluminum imports, which were implemented in 2018 to cut down on overcapacity and promote U.S. aluminum production. Suppliers, including Canada, Mexico, and European Union countries, have exemptions, but the tax still adds cost to imports.
U.S. agricultural imports have expanded in recent decades, with most products coming from Canada, Mexico, the EU, and South America. Common agricultural imports include fruits and vegetables—especially those that are tropical or out-of-season—as well as nuts, coffee, spices, and beverages. Turmoil with Russia was again a large contributor to cost increases in agricultural trade, alongside extreme weather events and disruptions in the supply chain. Americans felt these price hikes directly at the grocery store.
The U.S. imports significantly more than it exports, and added costs to those imports are felt far beyond its ports. If import prices continue to rise, overall inflation would likely follow, pushing already high prices even further for American consumers.
Story editing by Shannon Luders-Manuel. Copy editing by Kristen Wegrzyn.
This story originally appeared on Machinery Partner and was produced and
distributed in partnership with Stacker Studio.

Nearly every state requires drivers to carry car insurance, but the laws vary, and many factors affect the cost of coverage.
Some are controllable, at least to degrees: the type of car you have and your credit history. Some are not: your age and gender. Your marital status, place of residence, and claims history are among the other variables that go into it.
Across the United States, premiums are soaring, rising 20% year over year and increasing six times faster than consumer prices overall as of December 2023, CBS reported. Last September, CNN noted that car insurance rates jumped more in the previous year than they had since 1976.
CBS pointed to many potential reasons for these increases in prices. Coronavirus pandemic-era issues have made buying, fixing, and replacing vehicles costlier. Extreme weather events caused by climate change also damage more vehicles, while insurance companies are increasing their business costs. Severe and more frequent crashes are to blame as well, CNN reported.
On top of these, local factors such as population density, the number of uninsured drivers, and the frequency of insurance claims all affect premiums, which can lead motorists to change or switch their coverage, use other modes of transportation, or even alter decisions about when to buy a vehicle or what to look for.
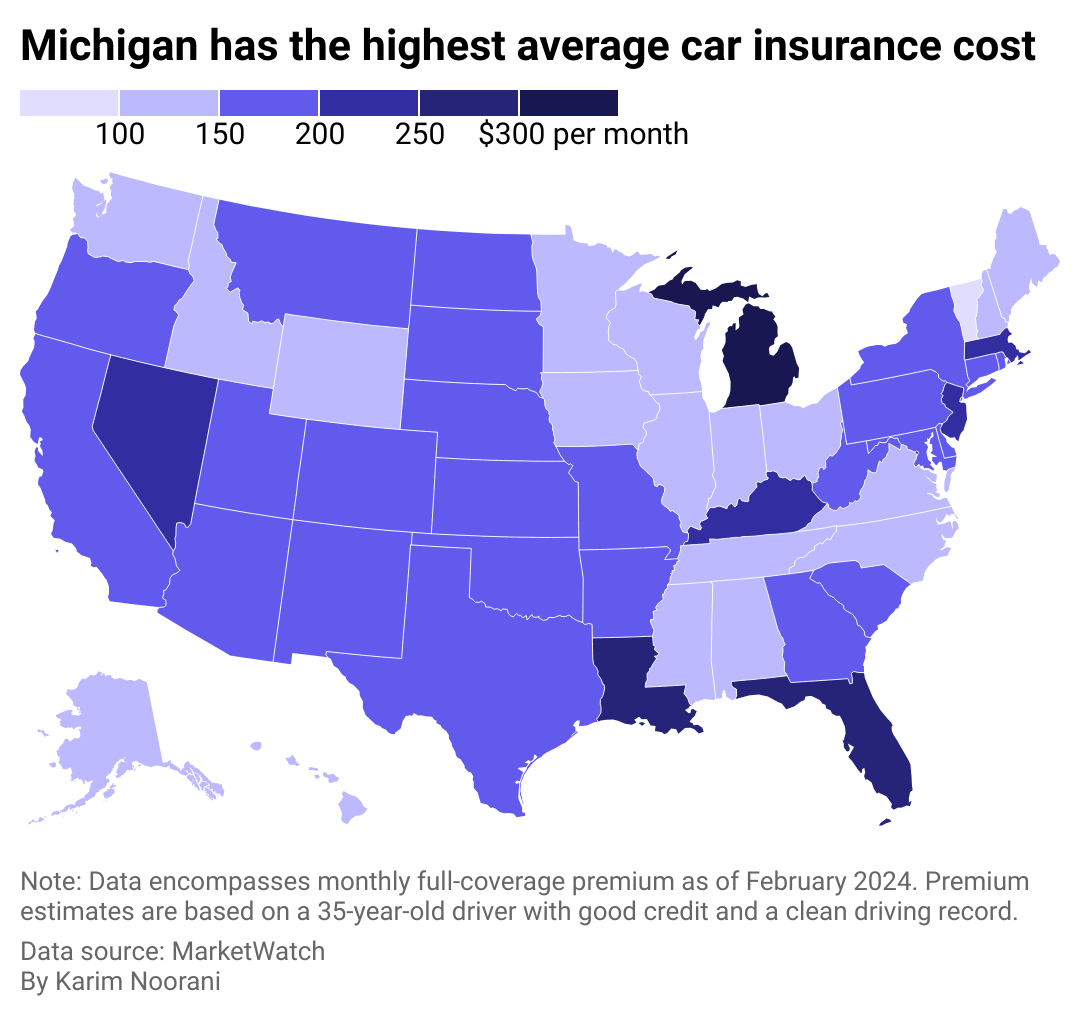
To see how geography affects cost, Cheap Insurance mapped the states where people pay the most in car insurance premiums using MarketWatch data. Premium estimates were based on full-coverage car insurance for a 35-year-old driver with good credit and a clean driving record. Data accurate as of February 2024.
![]()
Cheap Insurance
Americans pay $167 per month on average for full-coverage insurance
There are common denominators among the five states where it’s most expensive to have car insurance: Michigan, Florida, Louisiana, Nevada, and Kentucky. Washington D.C. is another pricey locale, ranking #4 overall.
Three of these six are no-fault jurisdictions and require additional coverage beyond coverage to pay for medical costs. Michigan notably calls for $250,000 in personal injury protection (though people with Medicaid and Medicare may qualify for lower limits), $1 million in personal property insurance for damage done by your car in Michigan, and residual bodily injury and property damage liability that starts at $250,000 for a person harmed in an accident.
Other commonalities between these states include high urban population densities. At least 9 in 10 people in Nevada, Florida, and Washington D.C. live in cities and urban areas, which leads to more crashes and thefts and high rates of uninsured drivers and lawsuits. Additionally, Louisiana, Florida, and Kentucky rank #5, #8, and #10, respectively, in motor vehicle crash deaths per 100 million vehicle miles traveled in 2021 based on Department of Transportation data analyzed by the Insurance Institute for Highway Safety.

Canva
#5. Kentucky
– Monthly full-coverage insurance: $210
– Monthly liability insurance: $57

Canva
#4. Nevada
– Monthly full-coverage insurance: $232
– Monthly liability insurance: $107

Canva
#3. Louisiana
– Monthly full-coverage insurance: $253
– Monthly liability insurance: $77

Canva
#2. Florida
– Monthly full-coverage insurance: $270
– Monthly liability insurance: $115

Canva
#1. Michigan
– Monthly full-coverage insurance: $304
– Monthly liability insurance: $113
Story editing by Carren Jao. Copy editing by Paris Close. Photo selection by Lacy Kerrick.
This story originally appeared on Cheap Insurance and was produced and
distributed in partnership with Stacker Studio.
Business
How businesses can protect themselves from the rising threat of deepfakes
Dive into the world of deepfakes and explore the risks, strategies and insights to fortify your organization’s defences

Dave is a journalist whose work has appeared in more than 100 media outlets around the world, including BBC, National Post, Washington Times, Globe and Mail, New York Times, Baltimore Sun.
-

 Business4 months ago
mesh conference goes deep on AI, with experts focusing in on training, ethics, and risk
-

 Business4 months ago
Skill-based hiring is the answer to labour shortages, BCG report finds
-

 Events6 months ago
Top 5 tech and digital transformation events to wrap up 2023
-

 People4 months ago
How connected technologies trim rework and boost worker safety in hands-on industries
-

 Events3 months ago
The Northern Lights Technology & Innovation Forum comes to Calgary next month