
Business
Highest-paid CEOs in America
Among the hotly contested debates in the contemporary United States is what to make of the vast discrepancy that exists between the salaries of the country’s top-earning CEOs and the average worker within their companies.
Alex Edmans of the Harvard Business Review has likened the discrepancy to that of a band’s lead singer and bassist, alluding to the fact that people who perform tasks of varying levels of importance in a company ought to receive compensation that reflects these differing contributions.
Using data from the American Federation of Labor and Congress of Industrial Organizations, Stacker listed the 100 highest-paid CEOs in the United States according to what they made in 2020, 2021, or 2022, depending on what data was available as of Nov. 30, 2022.
Read on to see how much the chief executives of top companies made.
You may also like: States with the most farmland
![]()

Tom Williams/CQ-Roll Call, Inc // Getty Images
#100. Charles Scharf (Wells Fargo & Co.)
– 2021 salary: $21.4 million
– Median worker pay: $73,578 (290:1 ratio)
Pavel Kapysh // Shutterstock
#99. Kevin Stein (TransDigm Group Inc.)
– 2021 salary: $21.5 million
– Median worker pay: $58,837 (365:1 ratio)
Michael Vi // Shutterstock
#98. David Ricks (Eli Lilly and Co.)
– 2021 salary: $21.5 million
– Median worker pay: $97,130 (221:1 ratio)

JL IMAGES // Shutterstock
#97. Daniel Glaser (Marsh & McLennan Companies Inc.)
– 2021 salary: $21.5 million
– Median worker pay: $67,143 (321:1 ratio)

T.Schneider // Shutterstock
#96. L. Hunn (Roper Technologies Inc.)
– 2021 salary: $21.5 million
– Median worker pay: $98,550 (219:1 ratio)
You may also like: Most popular grocery stores in America

Ima_ss // Shutterstock
#95. Joseph Hogan (Align Technology Inc.)
– 2021 salary: $21.6 million
– Median worker pay: $13,011 (1,659:1 ratio)

Horacio Villalobos#Corbis/Corbis // Getty Images
#94. Jamie Iannone (eBay Inc.)
– 2021 salary: $21.7 million
– Median worker pay: $135,528 (160:1 ratio)

Christopher Polk/Getty Images for International Medical Corps // Getty Images
#93. Robert Bradway (Amgen Inc.)
– 2021 salary: $21.7 million
– Median worker pay: $130,589 (166:1 ratio)
King4057 at English Wikipedia // Wikimedia Commons
#92. Anirudh Devgan (Cadence Design Systems Inc.)
– 2022 salary: $21.7 million
– Median worker pay: Not available

Alex Burstow/R&A/R&A // Getty Images
#91. Peter Zaffino (American International Group Inc.)
– 2021 salary: $21.9 million
– Median worker pay: $71,936 (305:1 ratio)
You may also like: The cost of gasoline the year you started driving
JOKER/Hartwig Lohmeyer/ullstein bild // Getty Images
#90. Walter Bettinger II (The Charles Schwab Corp.)
– 2021 salary: $21.9 million
– Median worker pay: $109,269 (201:1 ratio)
Coolcaesar at en.wikipedia // Wikimedia Commons
#89. Andrew Anagnost (Autodesk Inc.)
– 2022 salary: $22.1 million
– Median worker pay: $137,042 (161:1 ratio)
? CDA Productions (Las Vegas) Inc, 2003 // Getty Images
#88. Thomas Reeg (Caesars Entertainment Inc.)
– 2021 salary: $22.6 million
– Median worker pay: $35,618 (634:1 ratio)
JHVEPhoto // Shutterstock
#87. David Henshall (Citrix Systems Inc.)
– 2020 salary: $22.6 million
– Median worker pay: $129,724 (174:1 ratio)
Justin Sullivan // Getty Images
#86. Michael Wirth (Chevron Corp.)
– 2021 salary: $22.6 million
– Median worker pay: $183,531 (123:1 ratio)
You may also like: Youngest billionaires in America
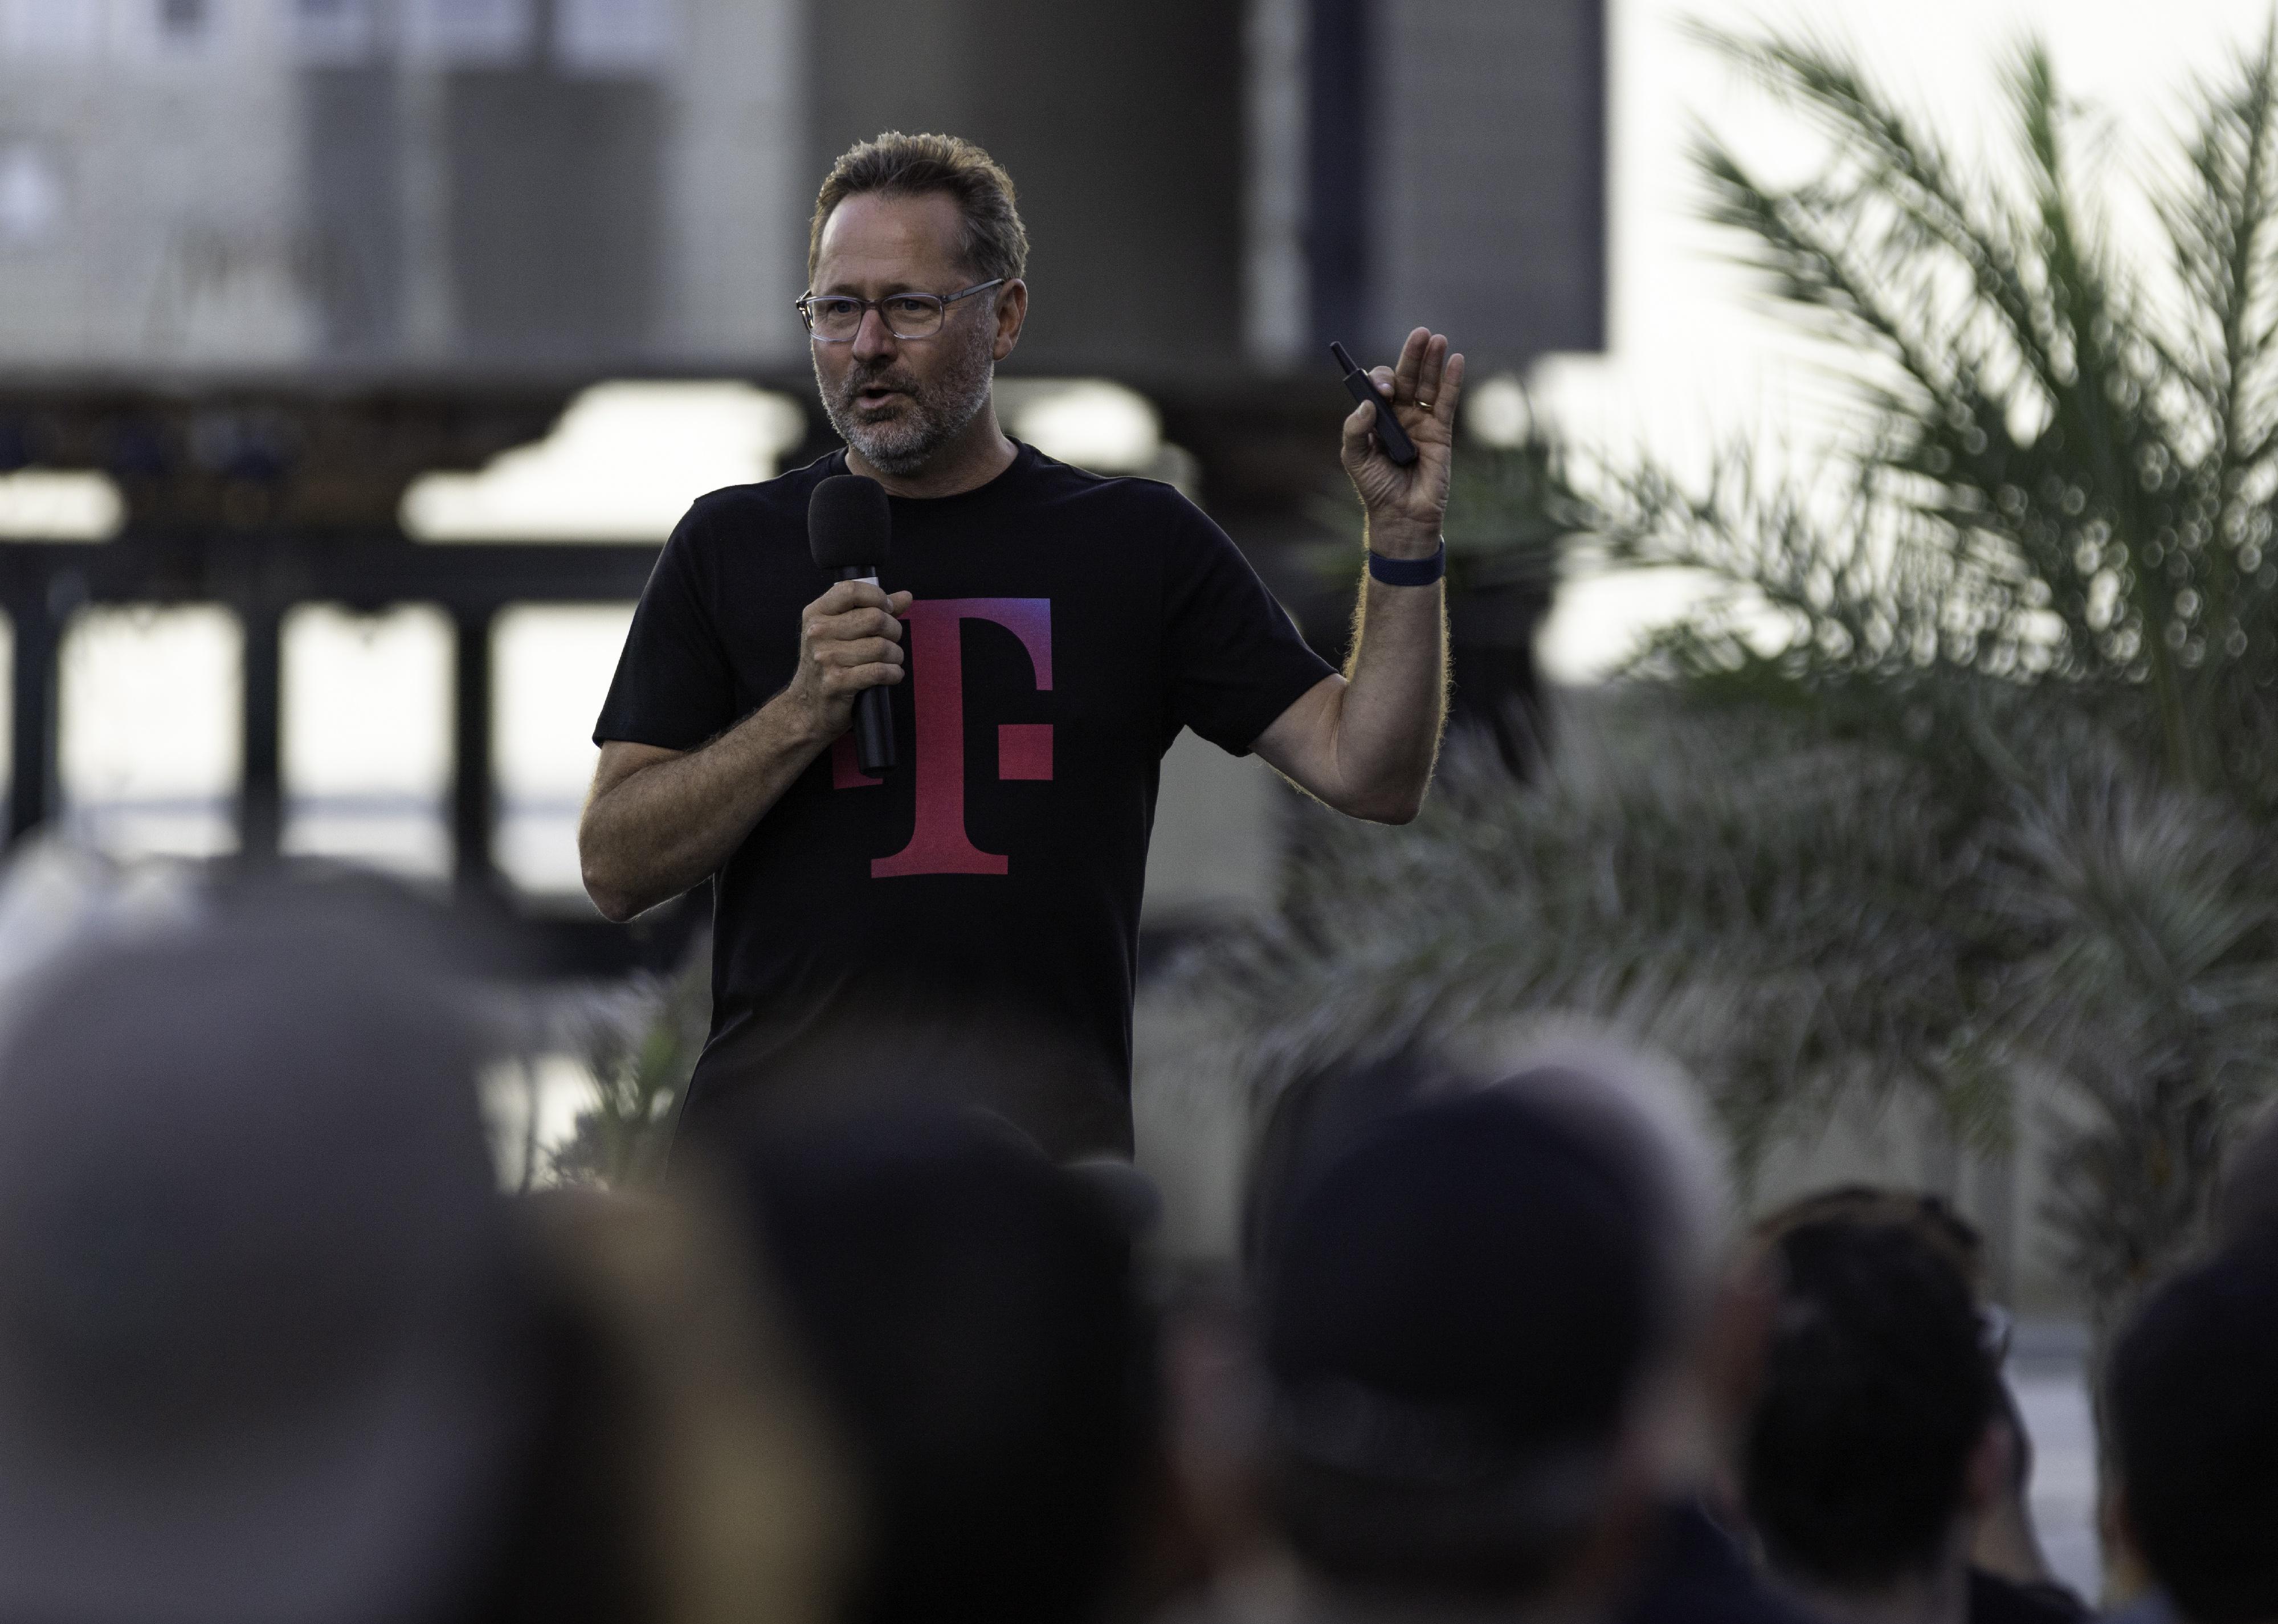
Michael Gonzalez // Getty Images
#85. G. Sievert (T-Mobile US Inc.)
– 2021 salary: $22.6 million
– Median worker pay: $72,572 (312:1 ratio)

Ian Dewar Photography // Shutterstock
#84. Jeffrey Storey (Lumen Technologies Inc.)
– 2021 salary: $22.7 million
– Median worker pay: $75,984 (298:1 ratio)
Jonathan Weiss // Shutterstock
#83. H. Culp Jr. (General Electric Co.)
– 2021 salary: $22.7 million
– Median worker pay: $55,064 (412:1 ratio)

Tada Images // Shutterstock
#82. Joseph Gorder (Valero Energy Corp.)
– 2021 salary: $22.7 million
– Median worker pay: $198,219 (114:1 ratio)

Spencer Platt // Getty Images
#81. James Farley Jr. (Ford Motor Co.)
– 2021 salary: $22.8 million
– Median worker pay: $64,003 (356:1 ratio)
You may also like: States with the largest unionized workforces

Tom Williams/CQ-Roll Call, Inc // Getty Images
#80. Terrence Duffy (CME Group Inc.)
– 2021 salary: $22.9 million
– Median worker pay: $153,565 (150:1 ratio)

Paul Morigi/Getty Images for The Wall Street Journal // Getty Images
#79. Robert Thomson (News Corp.)
– 2021 salary: $23.0 million
– Median worker pay: $68,984 (334:1 ratio)
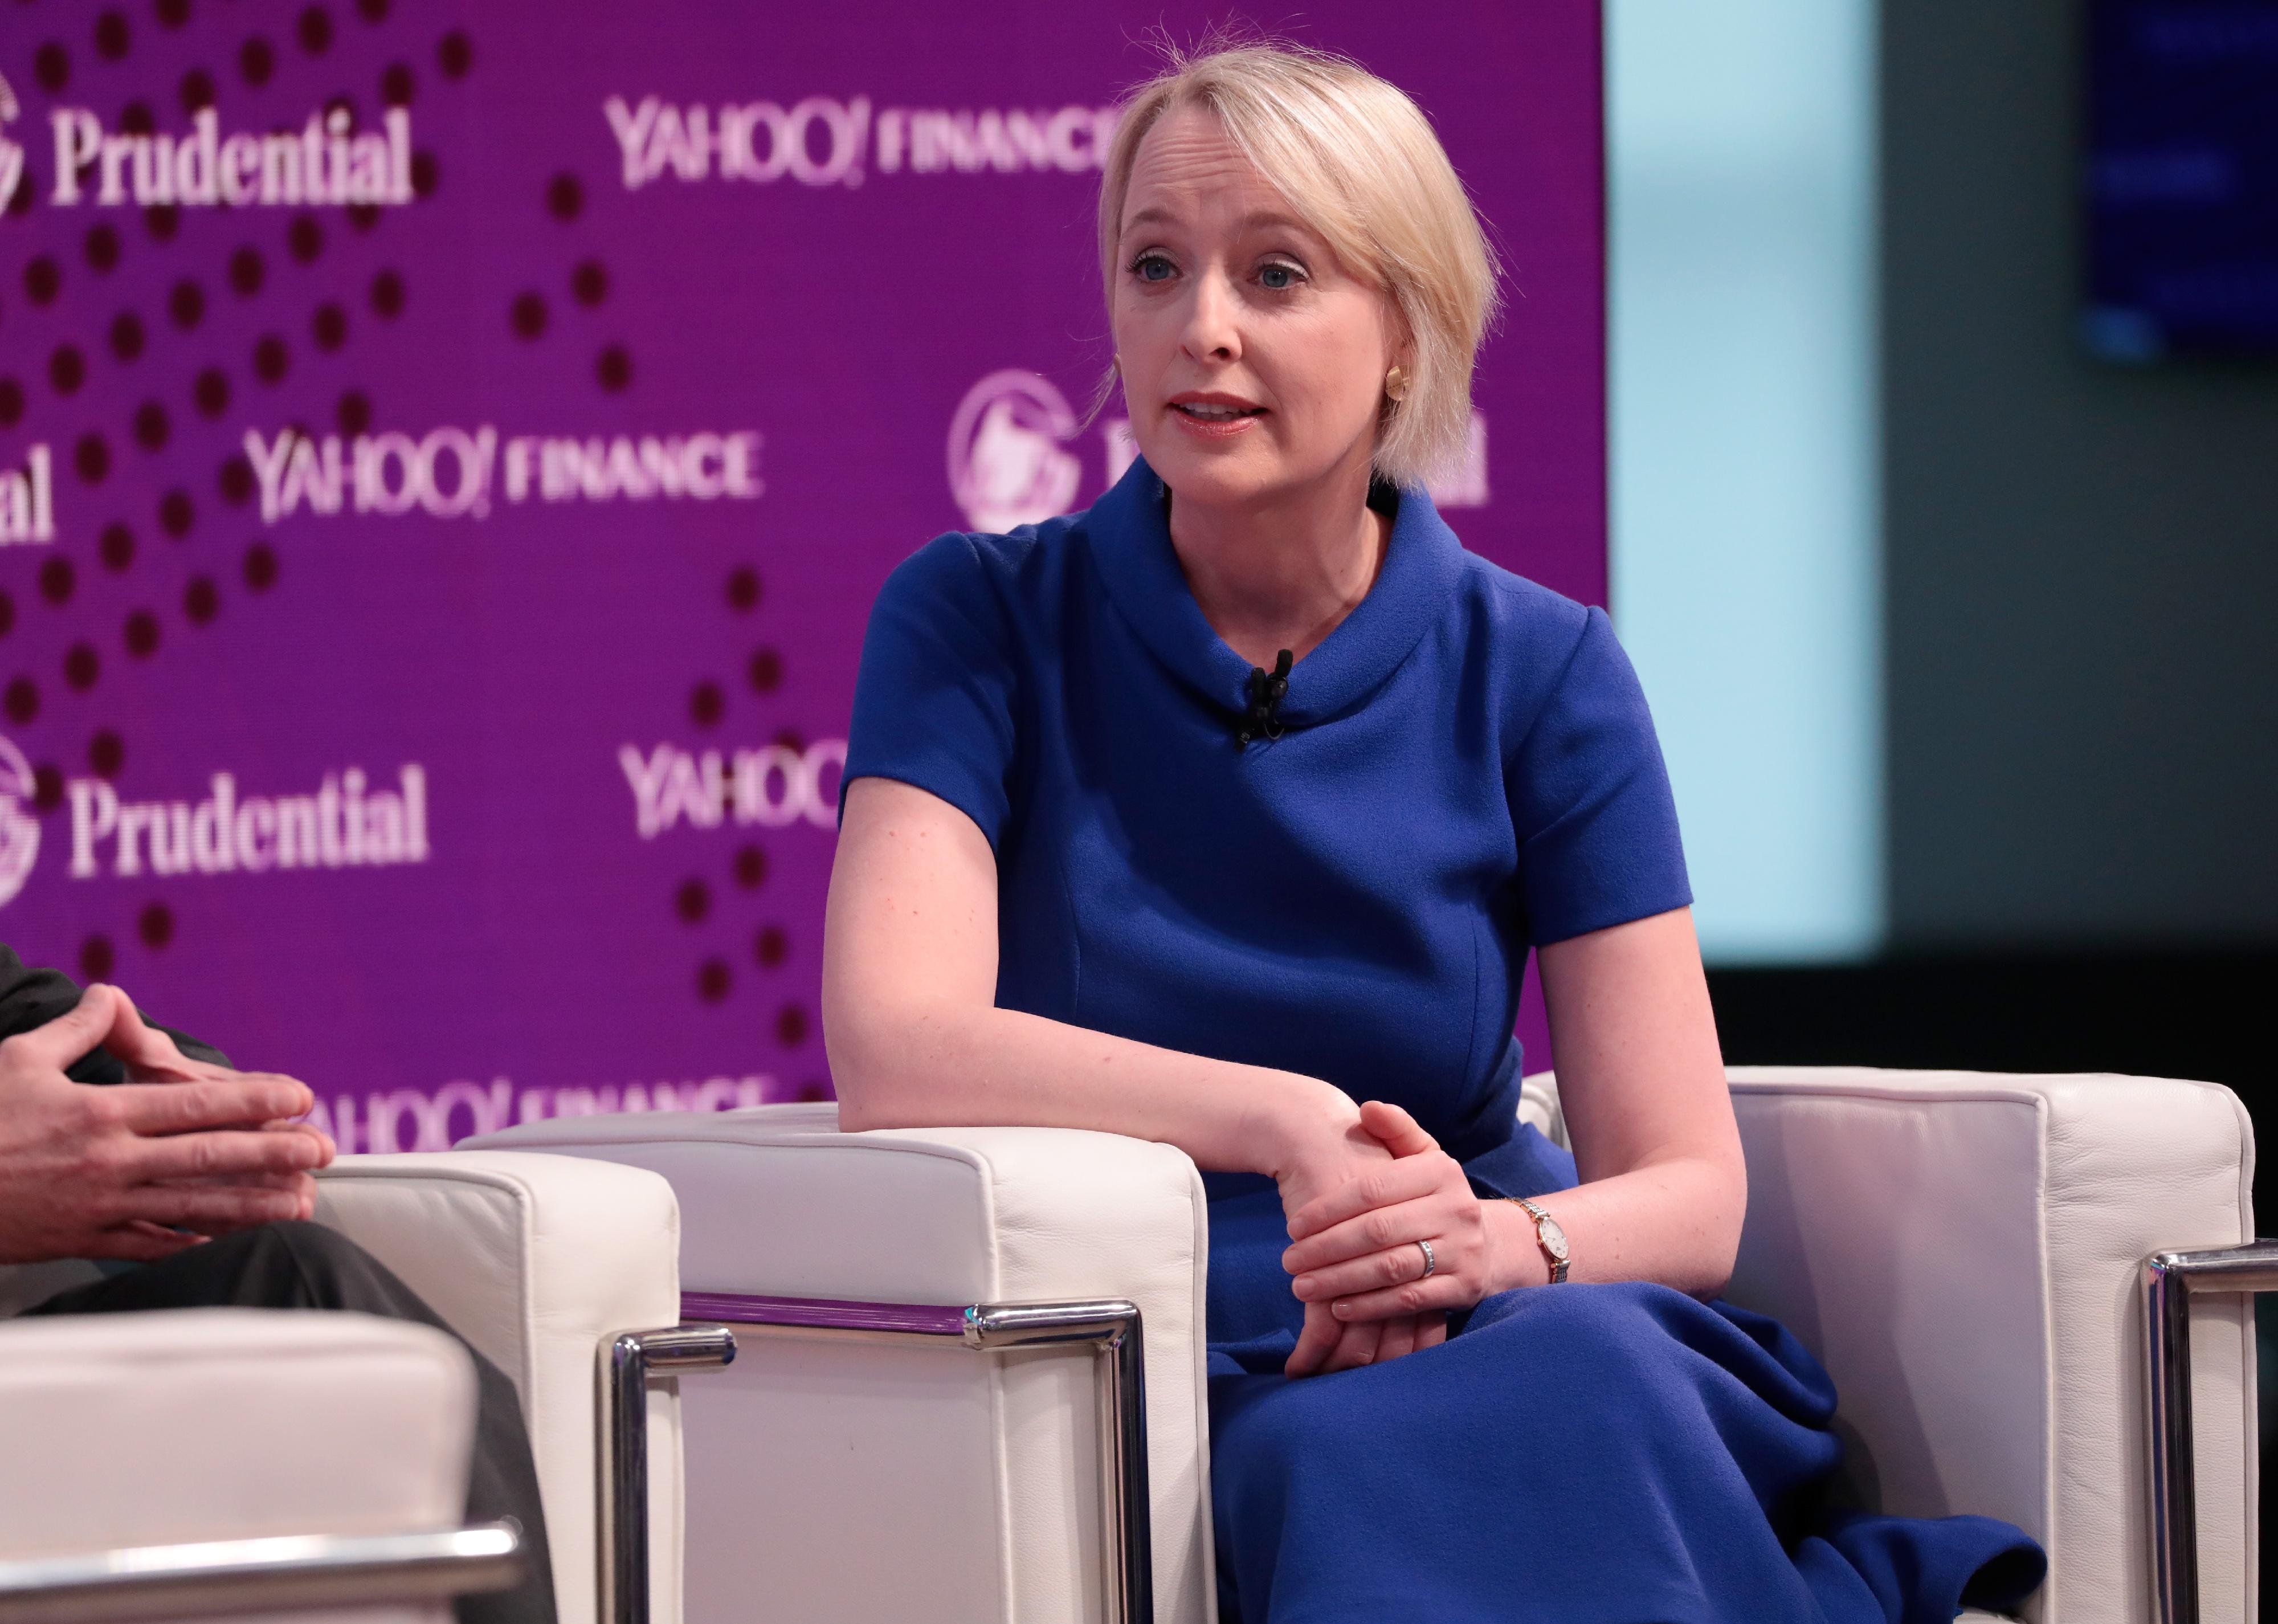
Cindy Ord/Getty Images for Yahoo // Getty Images
#78. Julie Sweet (Accenture Plc)
– 2021 salary: $23.1 million
– Median worker pay: $48,770 (473:1 ratio)

Wang Ying/Xinhua // Getty Images
#77. Evan Greenberg (Chubb Limited)
– 2021 salary: $23.2 million
– Median worker pay: $71,894 (322:1 ratio)

Tada Images // Shutterstock
#76. Kevin Hourican (Sysco Corp.)
– 2021 salary: $23.2 million
– Median worker pay: $75,209 (309:1 ratio)
You may also like: This is what really happens to retail food waste

Nhat V. Meyer/Bay Digital First Media/The Mercury News // Getty Images
#75. Charles Meyers (Equinix Inc.)
– 2021 salary: $23.2 million
– Median worker pay: $122,075 (190:1 ratio)

Drew Angerer // Getty Images
#74. Christopher Nassetta (Hilton Worldwide Holdings Inc.)
– 2021 salary: $23.3 million
– Median worker pay: $36,915 (631:1 ratio)

Riccardo Savi // Getty Images for Concordia Summit // Getty Images
#73. Gregory Hayes (Raytheon Technologies Corp.)
– 2021 salary: $23.3 million
– Median worker pay: $112,078 (208:1 ratio)

JHVEPhoto // Shutterstock
#72. Jeffrey Sloan (Global Payments Inc.)
– 2021 salary: $23.3 million
– Median worker pay: $56,202 (415:1 ratio)

Sundry Photography // Shutterstock
#71. Hafize Erkan (First Republic Bank)
– 2021 salary: $23.5 million
– Median worker pay: $162,300 (145:1 ratio)
You may also like: Famous consumer brands that no longer exist

Katherine Frey/The Washington Post // Getty Images
#70. Juan Luciano (Archer-Daniels-Midland Co.)
– 2021 salary: $23.5 million
– Median worker pay: $81,320 (290:1 ratio)

BRENDAN SMIALOWSKI/AFP // Getty Images
#69. Phebe Novakovic (General Dynamics Corp.)
– 2021 salary: $23.6 million
– Median worker pay: $92,585 (254:1 ratio)

Mark Schiefelbein/Pool // Getty Images
#68. Darren Woods (Exxon Mobil Corp.)
– 2021 salary: $23.6 million
– Median worker pay: $189,082 (125:1 ratio)

Brandon Bell // Getty Images
#67. Jeffrey Miller (Halliburton Co.)
– 2021 salary: $23.6 million
– Median worker pay: $81,076 (291:1 ratio)
John Lamparski // Getty Images
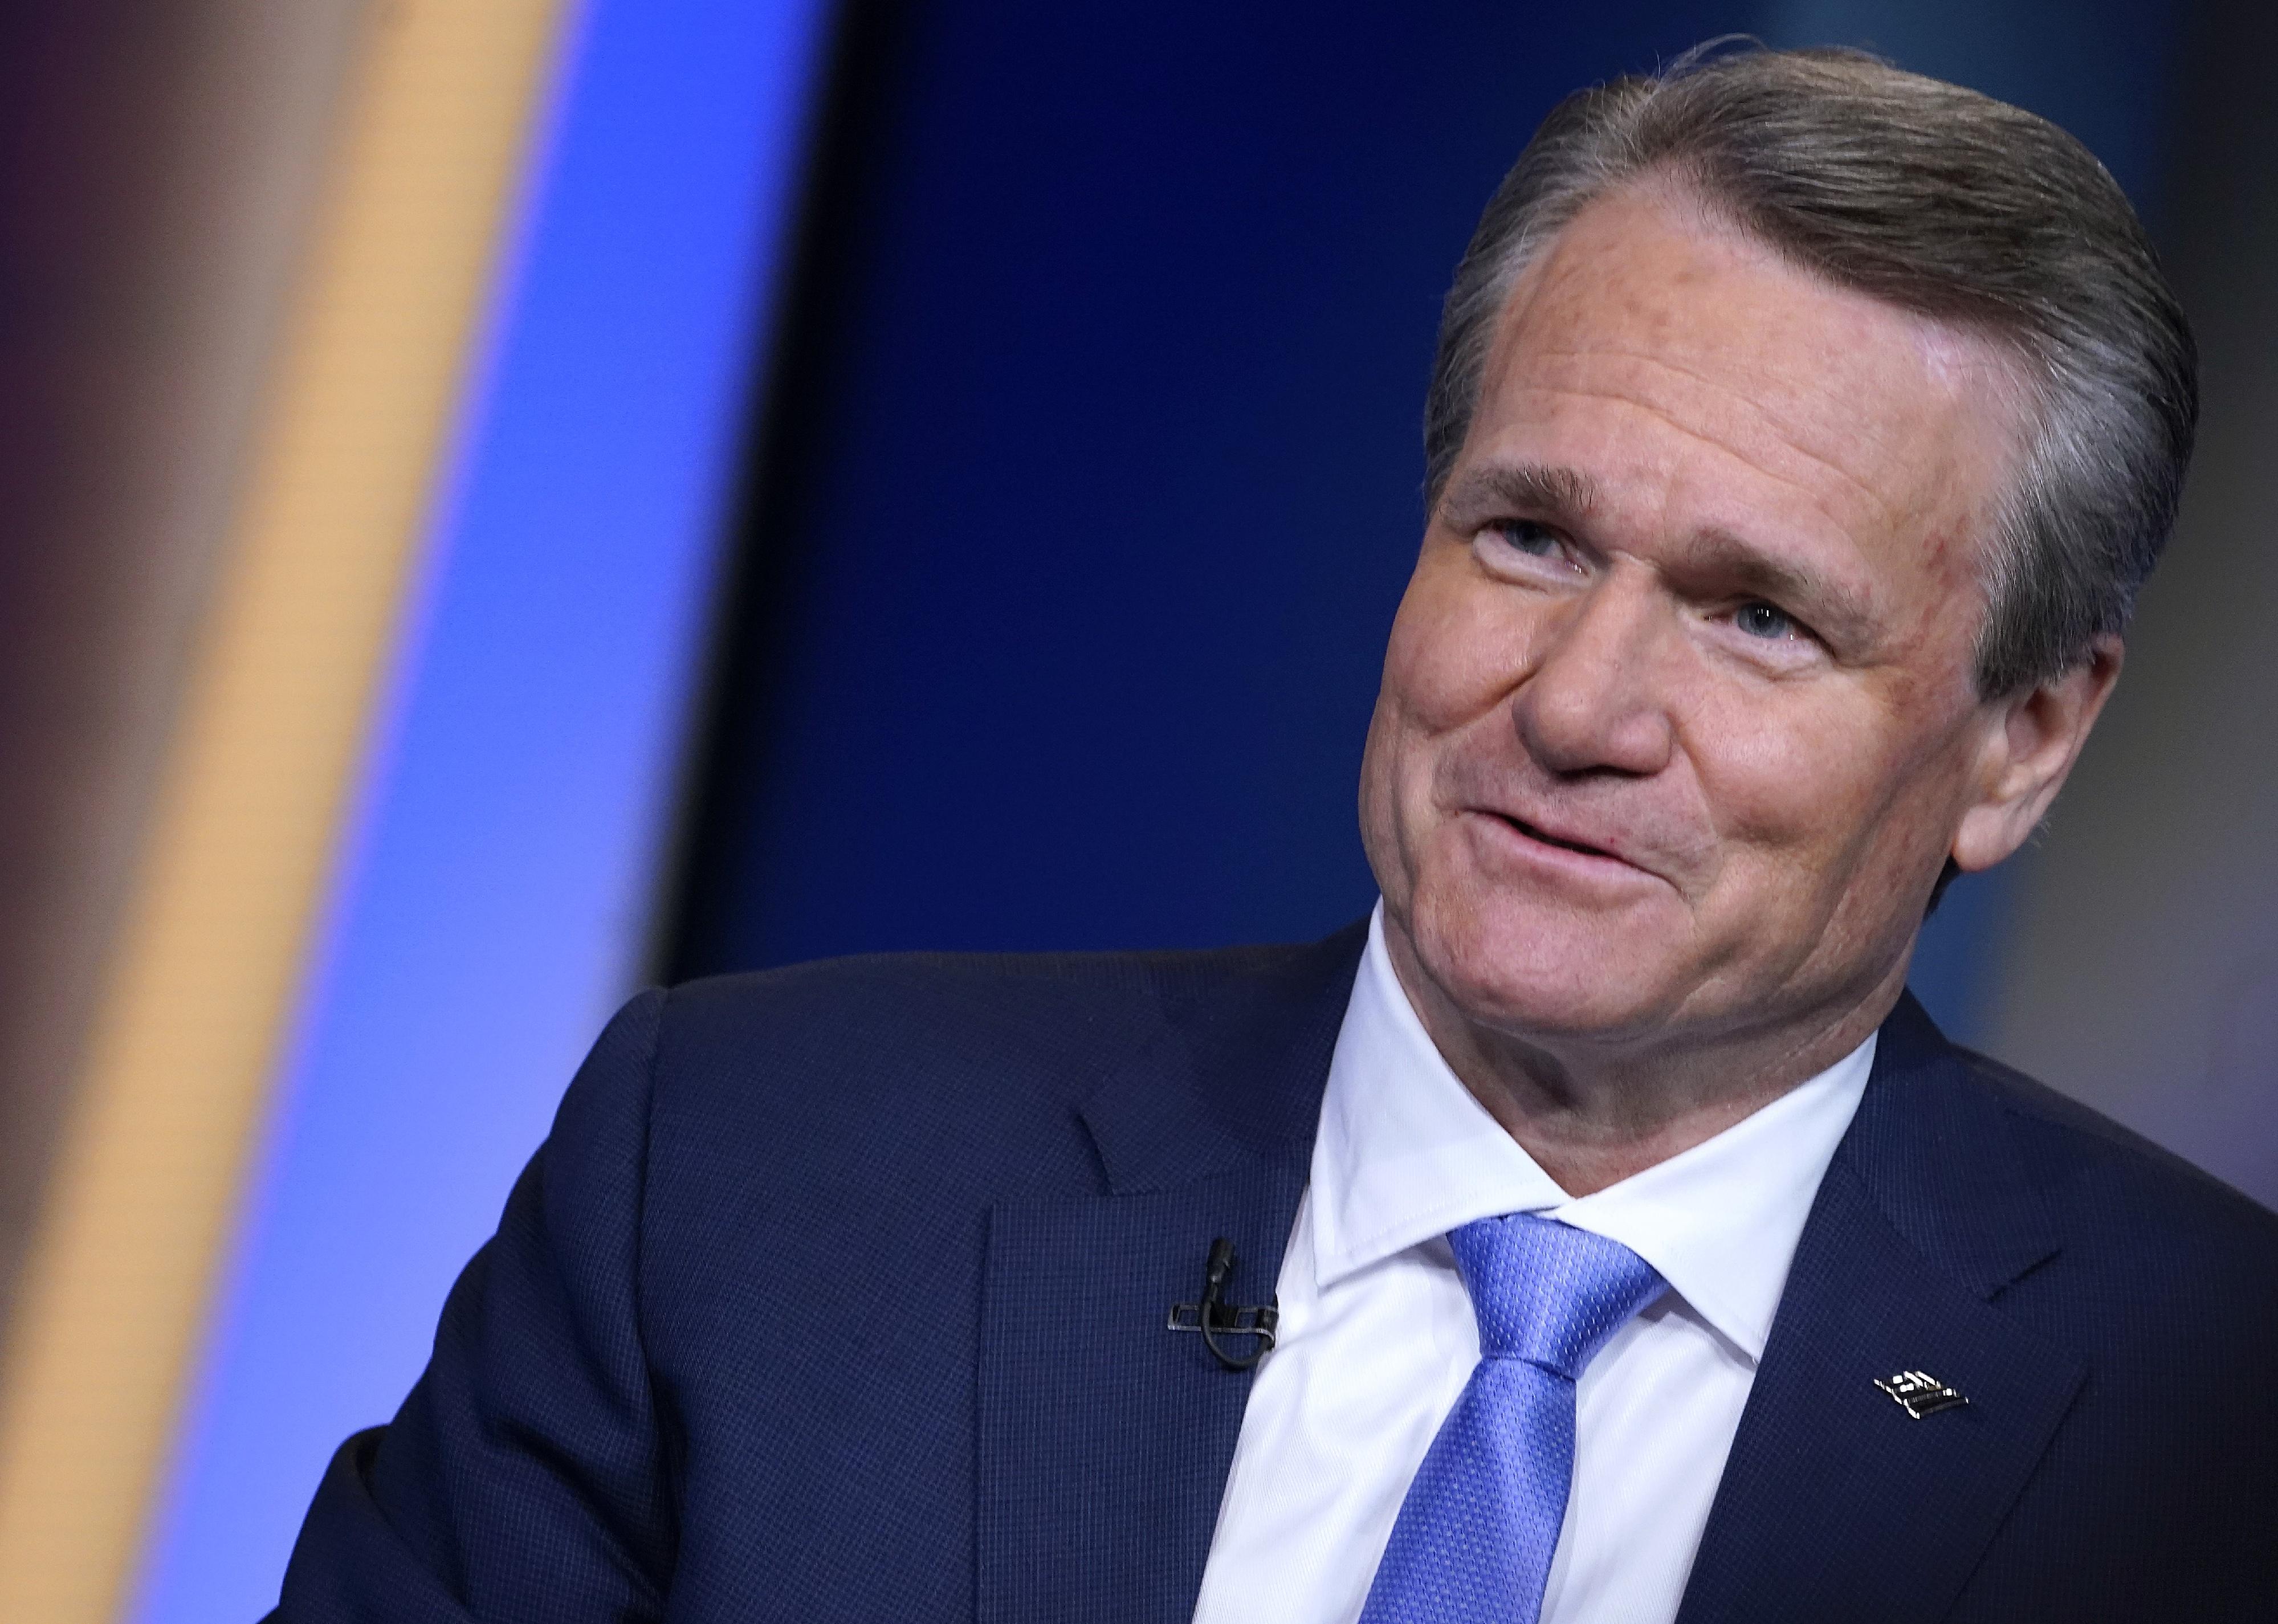
#66. Brian Moynihan (Bank of America Corp.)
– 2021 salary: $23.7 million
– Median worker pay: $102,497 (232:1 ratio)
You may also like: Most popular department stores in America
SAM YEH/AFP // Getty Images
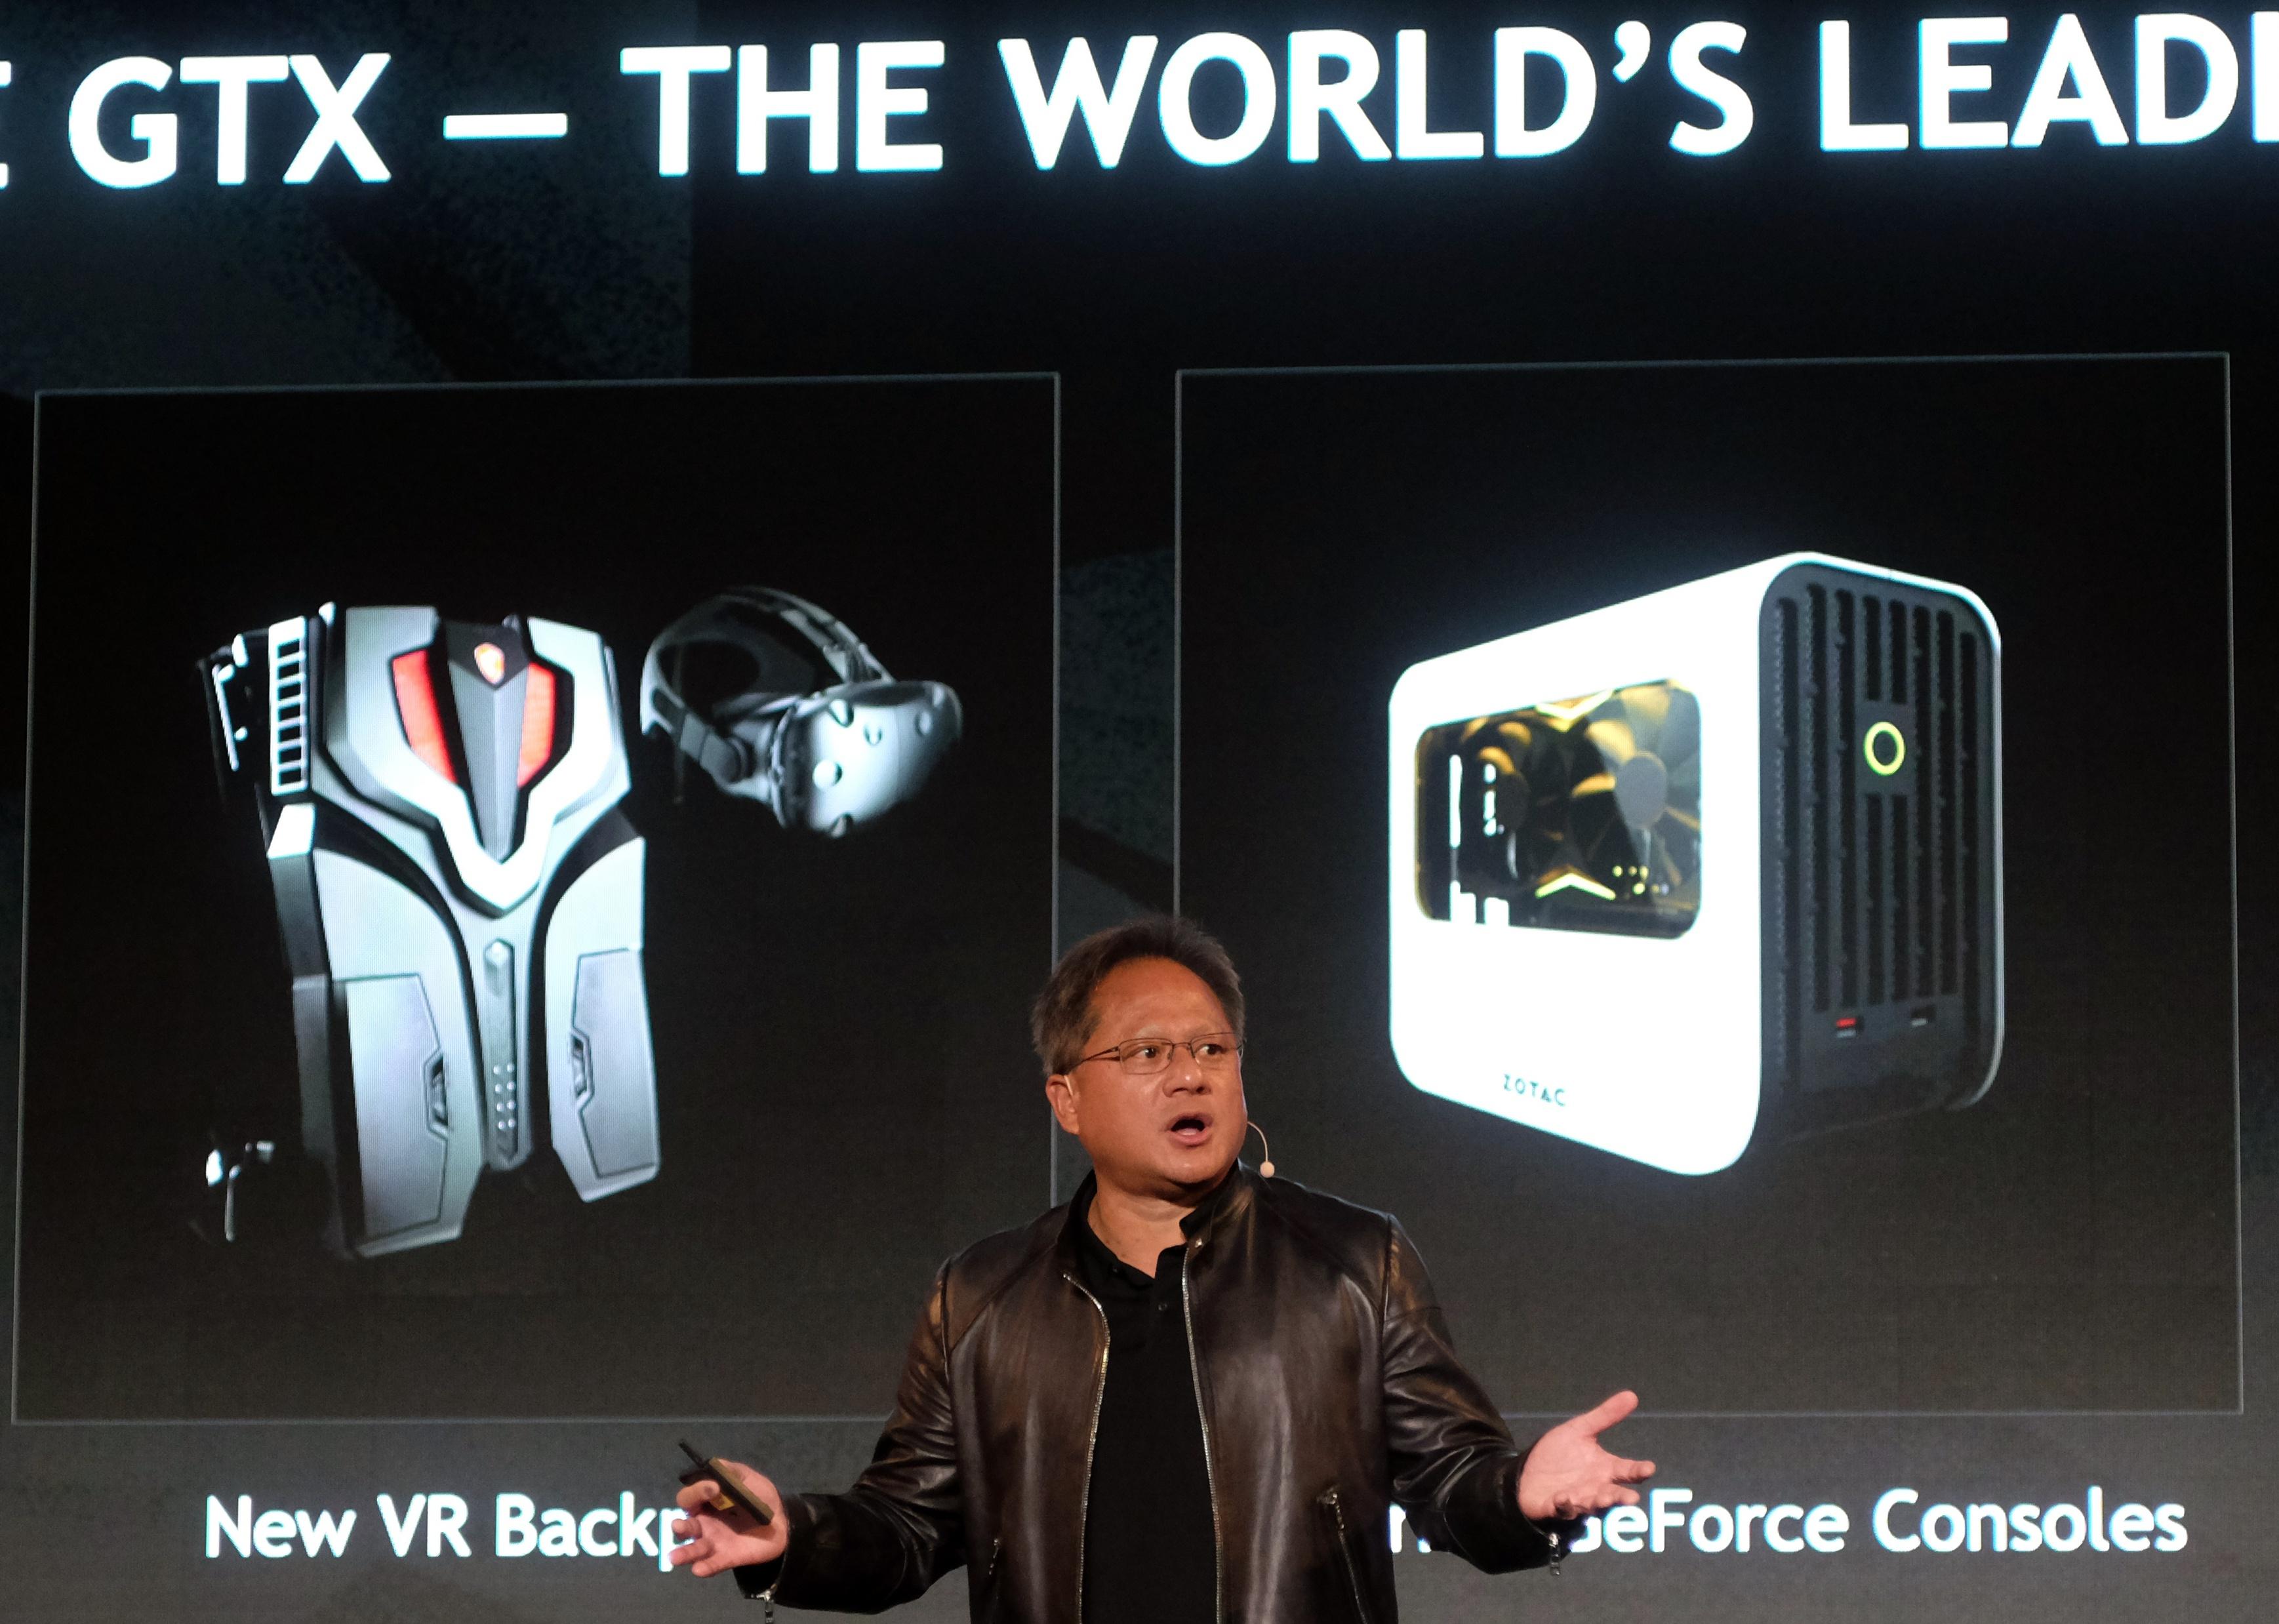
#65. Jen-Hsun Huang (NVIDIA Corp.)
– 2022 salary: $23.7 million
– Median worker pay: $217,542 (109:1 ratio)

JHVEPhoto // Shutterstock
#64. Ryan Lance (ConocoPhillips)
– 2021 salary: $23.9 million
– Median worker pay: $179,428 (133:1 ratio)
Duane Prokop/Getty Images for Procter & Gamble // Getty Images
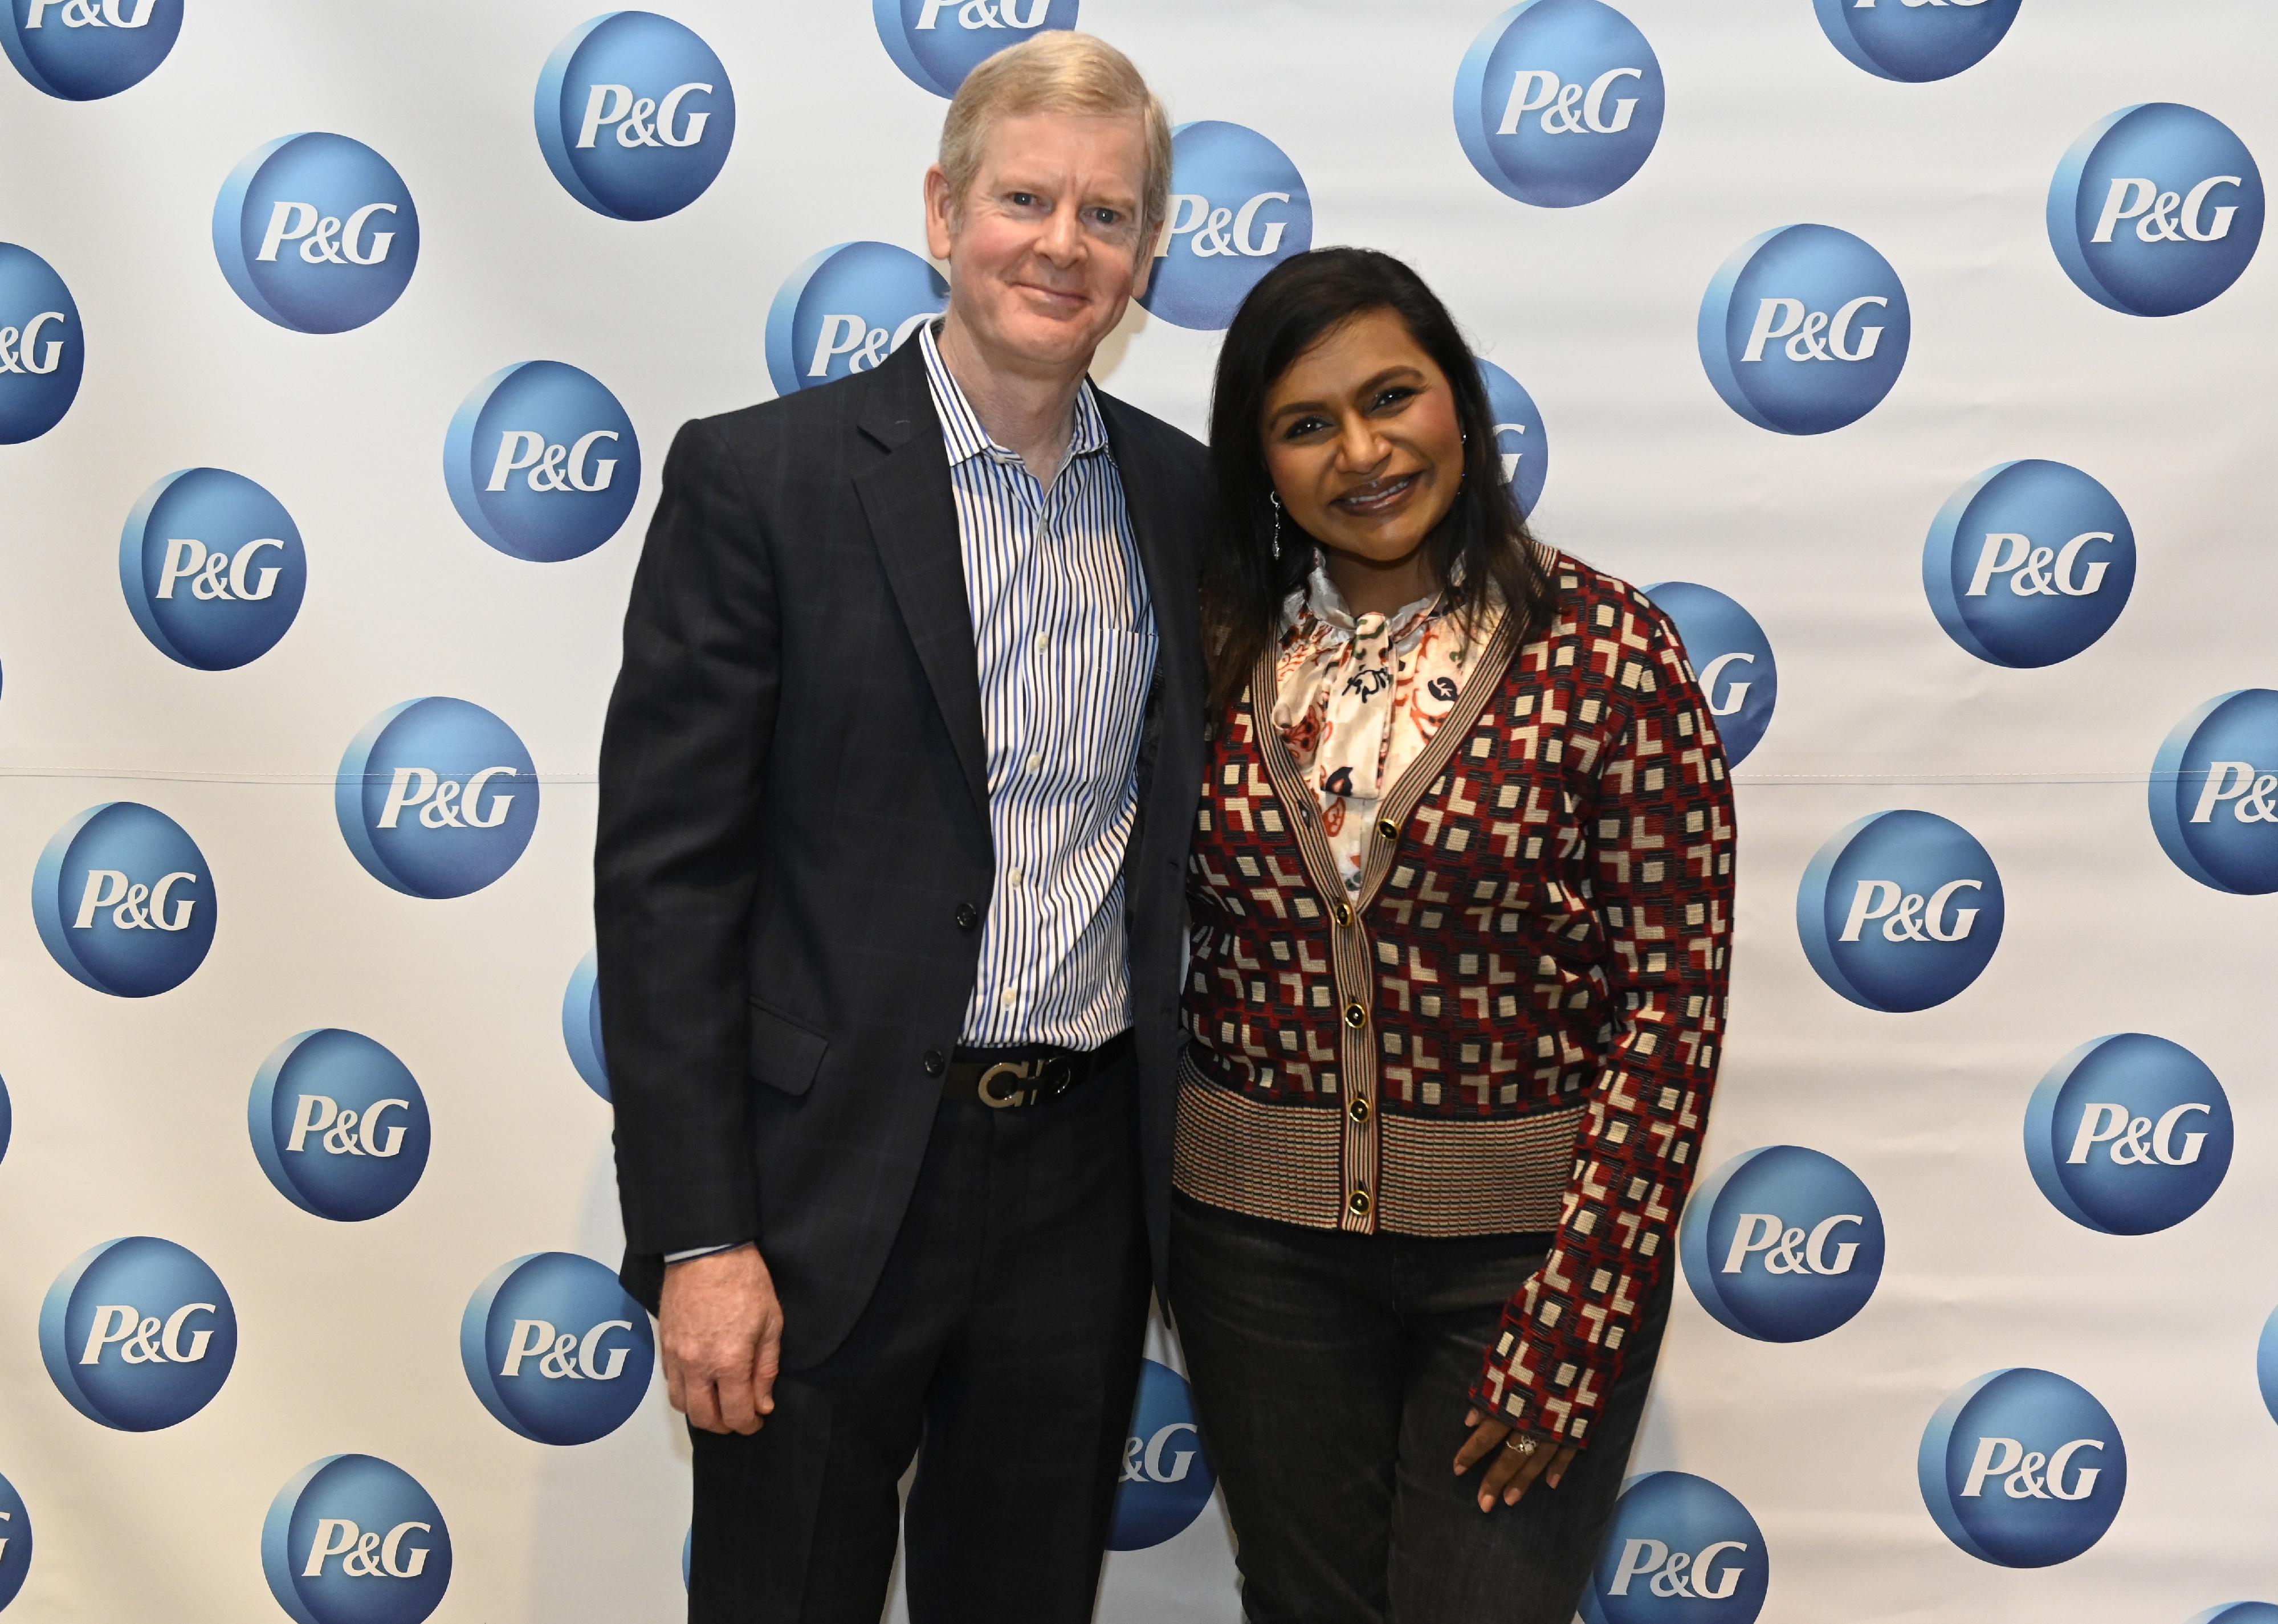
#63. David Taylor (The Procter & Gamble Co.)
– 2021 salary: $23.9 million
– Median worker pay: $69,671 (343:1 ratio)

Dmitry Kalinovsky // Shutterstock
#62. Richard Gonzalez (AbbVie Inc.)
– 2021 salary: $23.9 million
– Median worker pay: $149,662 (160:1 ratio)

Cineberg // Shutterstock
#61. Donald Umpleby III (Caterpillar Inc.)
– 2021 salary: $24.3 million
– Median worker pay: $51,102 (475:1 ratio)
You may also like: Retirement scams to watch out for
Drew Angerer // Getty Images
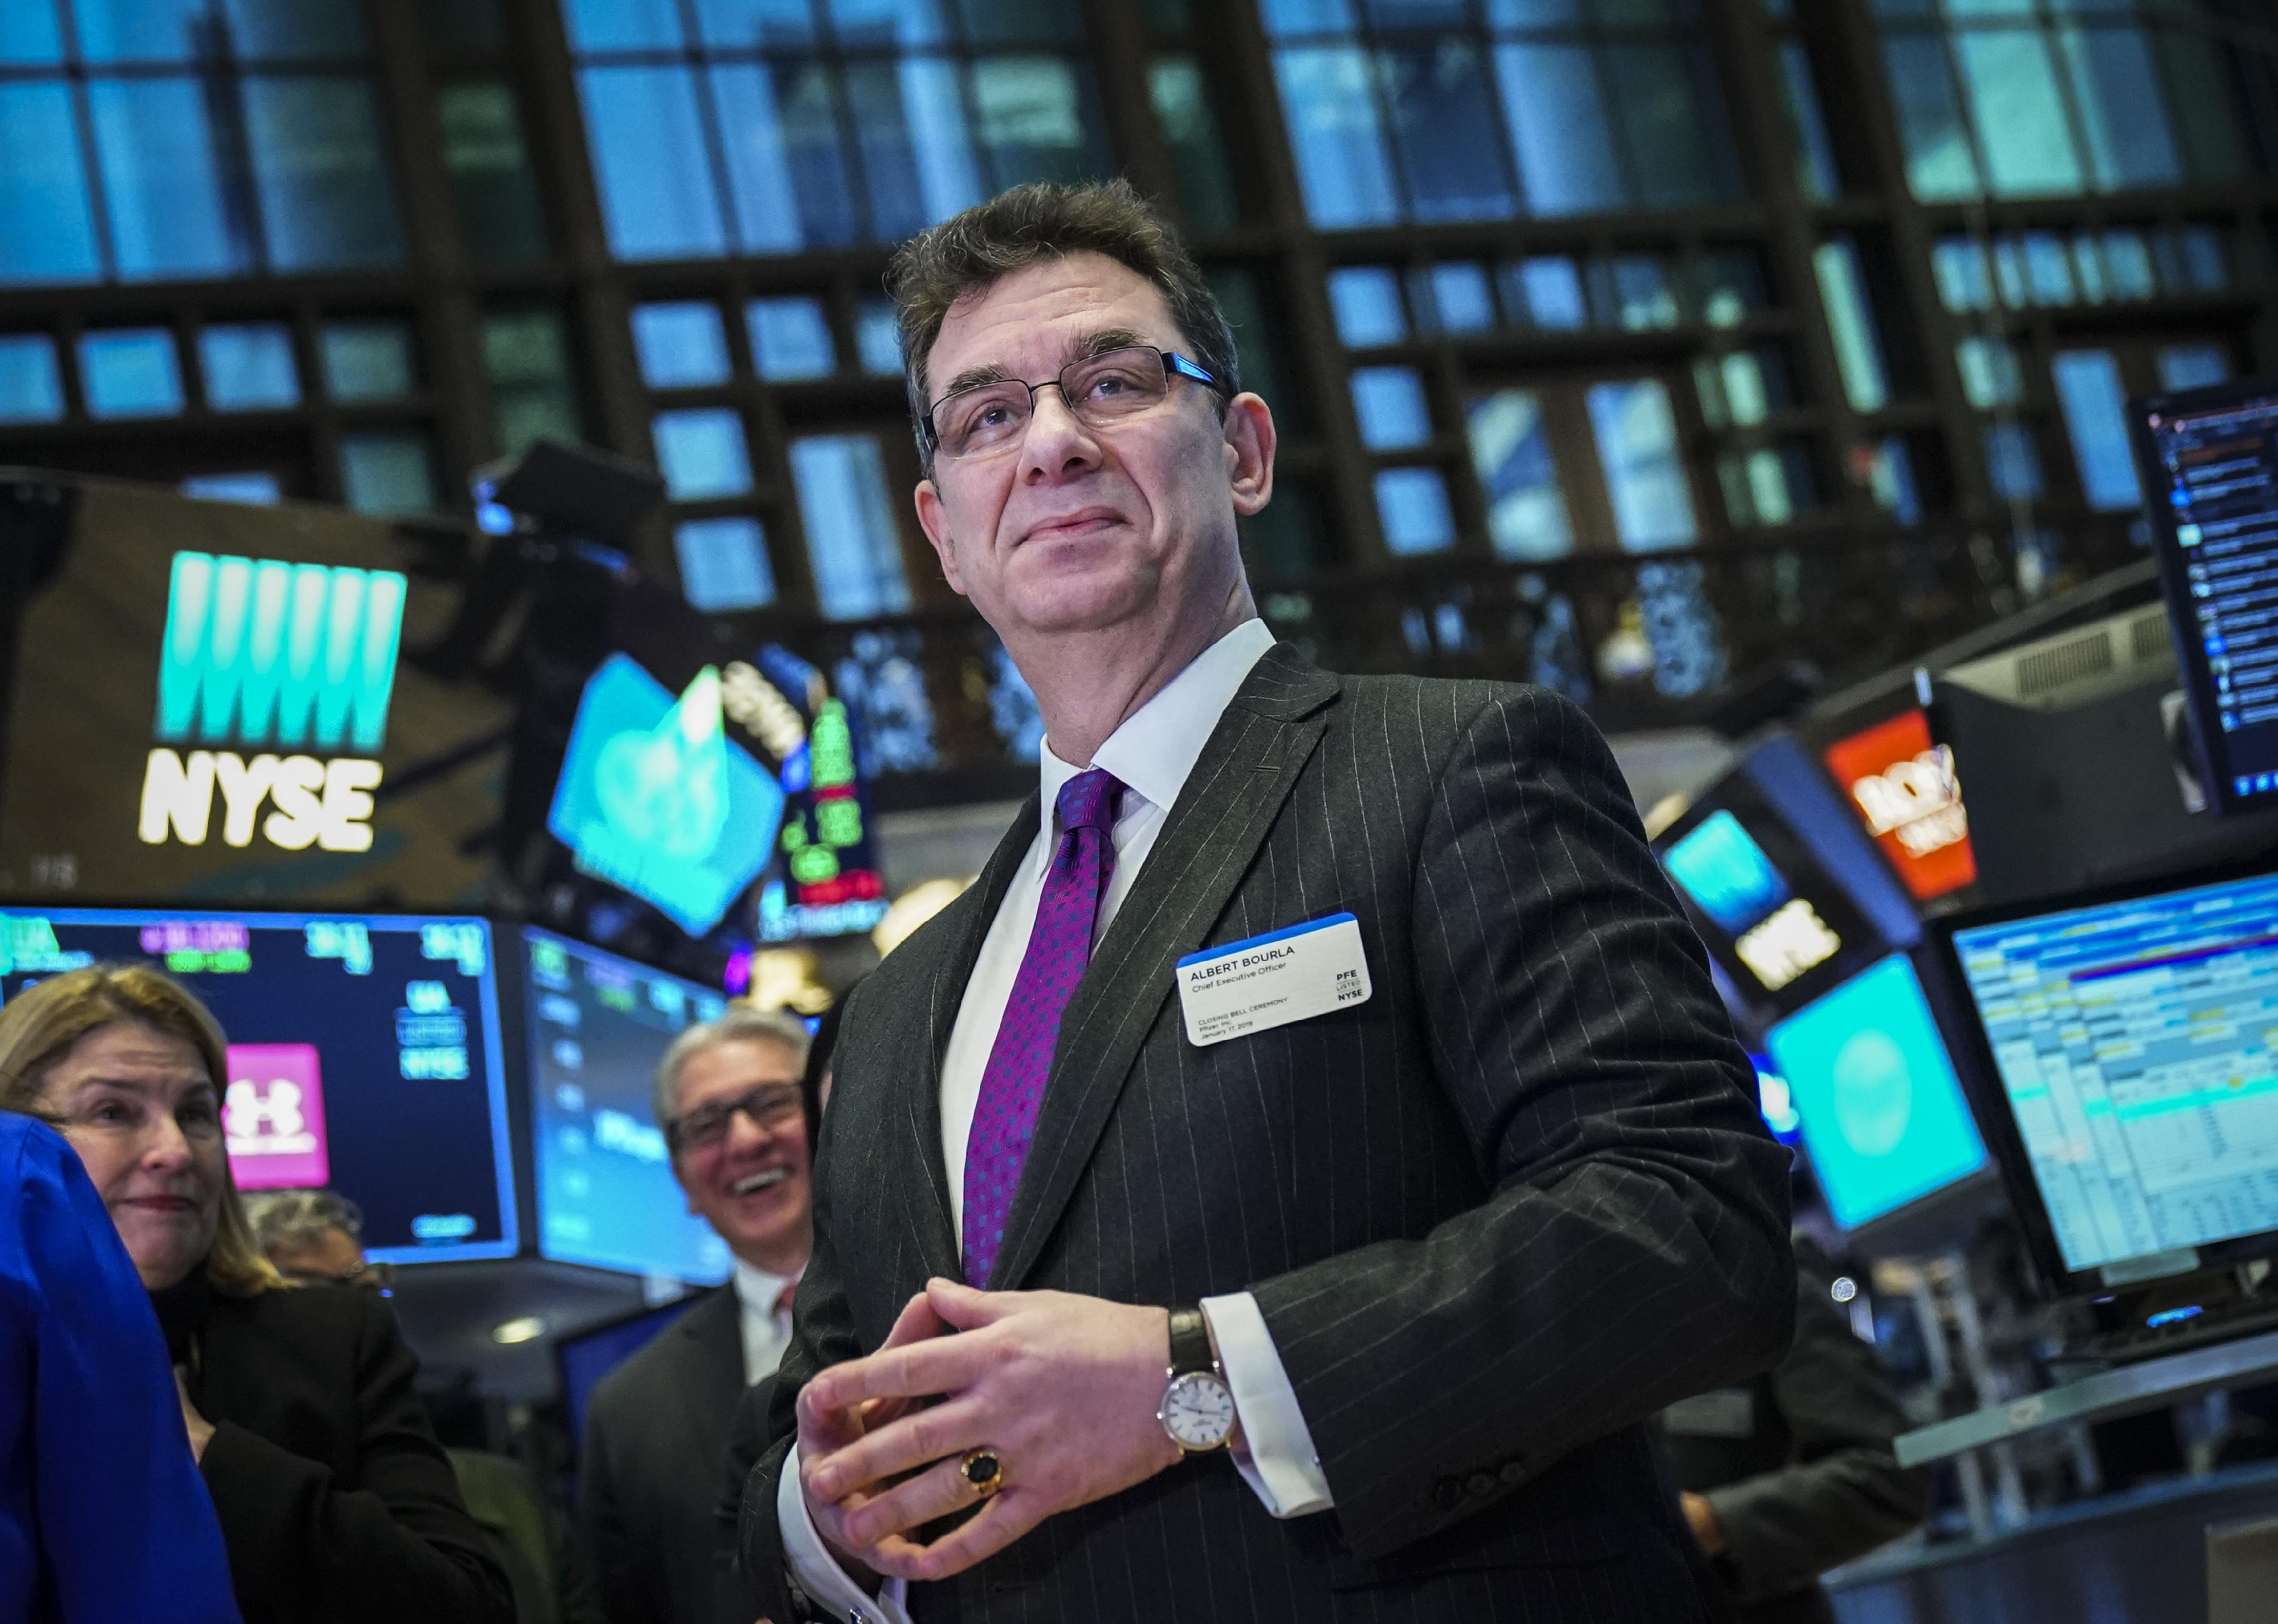
#60. Albert Bourla (Pfizer Inc.)
– 2021 salary: $24.4 million
– Median worker pay: $92,986 (262:1 ratio)

Bfriedl // Wikimedia Commons
#59. Jeffrey Martin (Sempra Energy)
– 2021 salary: $24.7 million
– Median worker pay: $137,800 (179:1 ratio)
John Lamparski/Getty Images for Advertising Week New York // Getty Images
#58. John Stankey (AT&T Inc.)
– 2021 salary: $24.8 million
– Median worker pay: $107,570 (231:1 ratio)
Spencer Platt // Getty Images
#57. James Fitterling (Dow Inc.)
– 2021 salary: $24.9 million
– Median worker pay: $95,607 (260:1 ratio)

FABRICE COFFRINI/AFP // Getty Images
#56. James Quincey (The Coca-Cola Co.)
– 2021 salary: $24.9 million
– Median worker pay: $13,894 (1,791:1 ratio)
You may also like: Richest and poorest states in America

Kimberly White/Getty Images for PARS EQUALITY CENTER // Getty Images
#55. Hamid Moghadam (Prologis Inc.)
– 2021 salary: $24.9 million
– Median worker pay: $114,183 (218:1 ratio)
PATRICK T. FALLON/AFP // Getty Images
#54. Robert Ford (Abbott Laboratories)
– 2021 salary: $24.9 million
– Median worker pay: $97,952 (254:1 ratio)

Intuit Corp. // Wikimedia Commons
#53. Sasan Goodarzi (Intuit Inc.)
– 2021 salary: $24.9 million
– Median worker pay: $176,342 (141:1 ratio)

JHVEPhoto // Shutterstock
#52. Gary Norcross (Fidelity National Information Services Inc.)
– 2021 salary: $25.0 million
– Median worker pay: $64,135 (390:1 ratio)

MANDEL NGAN/AFP // Getty Images
#51. Sanjay Mehrotra (Micron Technology Inc.)
– 2021 salary: $25.3 million
– Median worker pay: $64,827 (391:1 ratio)
You may also like: Cost of gold the year you were born

R.Danyliuk // Shutterstock
#50. James Robo (NextEra Energy Inc.)
– 2021 salary: $25.3 million
– Median worker pay: $132,798 (191:1 ratio)

Match Group // Wikimedia Commons
#49. Sharmistha Dubey (Match Group Inc.)
– 2021 salary: $25.4 million
– Median worker pay: $106,881 (238:1 ratio)
Ken Wolter // Shutterstock
#48. Charles Robbins (Cisco Systems Inc.)
– 2021 salary: $25.4 million
– Median worker pay: $124,806 (204:1 ratio)

FABRICE COFFRINI/AFP // Getty Images
#47. Ramon Laguarta (PepsiCo Inc.)
– 2021 salary: $25.5 million
– Median worker pay: $52,297 (488:1 ratio)
JHVEPhoto // Shutterstock
#46. Stephen Squeri (American Express Co.)
– 2021 salary: $25.5 million
– Median worker pay: $67,460 (378:1 ratio)
You may also like: 50 most popular chain restaurants in America

Rick T. Wilking // Getty Images
#45. C. McMillon (Walmart Inc.)
– 2022 salary: $25.7 million
– Median worker pay: $25,335 (1,013:1 ratio)

BRENDAN SMIALOWSKI // Getty Images
#44. Darius Adamczyk (Honeywell International Inc.)
– 2021 salary: $26.1 million
– Median worker pay: $75,529 (346:1 ratio)

JIM WATSON/AFP // Getty Images
#43. Alex Gorsky (Johnson & Johnson)
– 2022 salary: $26.7 million
– Median worker pay: $90,000 (297:1 ratio)

Joe Raedle // Getty Images
#42. David Gibbs (Yum! Brands Inc.)
– 2021 salary: $27.6 million
– Median worker pay: $13,082 (2,108:1 ratio)

JIM WATSON/AFP // Getty Images
#41. Carol Tome (United Parcel Service Inc.)
– 2021 salary: $27.6 million
– Median worker pay: $50,379 (548:1 ratio)
You may also like: 15 cars that depreciated the most last year

Drew Angerer // Getty Images
#40. Lachlan Murdoch (Fox Corp.)
– 2021 salary: $27.7 million
– Median worker pay: $80,732 (343:1 ratio)

JASON REDMOND/AFP // Getty Images
#39. Rosalind Brewer (Walgreens Boots Alliance Inc.)
– 2021 salary: $28.3 million
– Median worker pay: $26,255 (1,084:1 ratio)
Roy Rochlin // Getty Images
#38. Marc Benioff (Salesforce Inc.)
– 2022 salary: $28.6 million
– Median worker pay: $181,612 (157:1 ratio)

Syda Productions // Shutterstock
#37. Ari Bousbib (IQVIA Holdings Inc.)
– 2021 salary: $28.6 million
– Median worker pay: $139,803 (205:1 ratio)
Rafael Henrique/SOPA Images/LightRocket // Getty Images
#36. Michael Salvino (DXC Technology Co.)
– 2022 salary: $28.7 million
– Median worker pay: $44,156 (650:1 ratio)
You may also like: Do you know the brands behind these famous slogans?

Drew Angerer // Getty Images
#35. Mary Barra (General Motors Co.)
– 2021 salary: $29.1 million
– Median worker pay: $69,433 (420:1 ratio)

Victor Moussa // Shutterstock
#34. Lisa Su (Advanced Micro Devices Inc.)
– 2021 salary: $29.5 million
– Median worker pay: $128,263 (230:1 ratio)

Kevin Dietsch // Getty Images
#33. Parag Agrawal (Twitter Inc.)
– 2021 salary: $30.4 million
– Median worker pay: $232,626 (130:1 ratio)

Canva
#32. David Auld (D.R. Horton Inc.)
– 2021 salary: $30.6 million
– Median worker pay: $107,880 (284:1 ratio)

Brian Lawless/PA Images // Getty Images
#31. Vincent Roche (Analog Devices Inc.)
– 2021 salary: $30.8 million
– Median worker pay: $46,141 (668:1 ratio)
You may also like: Richest women in America

Michael Kovac // Getty Images
#30. Alfred Kelly Jr. (Visa Inc.)
– 2021 salary: $30.9 million
– Median worker pay: $146,420 (211:1 ratio)

Jun Sato/WireImage // Getty Images
#29. Robert G. Goldstein (Las Vegas Sands Corp.)
– 2021 salary: $31.2 million
– Median worker pay: $35,879 (866:1 ratio)

picture alliance // Getty Images
#28. Stephen Angel (Linde Plc)
– 2021 salary: $31.4 million
– Median worker pay: $40,659 (773:1 ratio)
Chip Somodevilla // Getty Images
#27. Ernie Herrman (The TJX Companies Inc.)
– 2022 salary: $31.8 million
– Median worker pay: $14,139 (2,249:1 ratio)
Michael Loccisano // Getty Images
#26. Daniel Schulman (PayPal Holdings Inc.)
– 2021 salary: $32.1 million
– Median worker pay: $83,905 (382:1 ratio)
You may also like: 50 car companies that no longer exist

Gerardo Mora // Getty Images
#25. Robert Chapek (The Walt Disney Co.)
– 2021 salary: $32.5 million
– Median worker pay: $50,430 (644:1 ratio)

FABRICE COFFRINI/AFP // Getty Images
#24. Laurence Fink (BlackRock Inc.)
– 2021 salary: $32.6 million
– Median worker pay: $164,492 (198:1 ratio)

Kevin Dietsch // Getty Images
#23. John Donahoe II (NIKE Inc.)
– 2021 salary: $32.9 million
– Median worker pay: $36,077 (913:1 ratio)
Joshua Rainey Photography // Shutterstock
#22. Brian Roberts (Comcast Corp.)
– 2021 salary: $34.0 million
– Median worker pay: $83,840 (405:1 ratio)
Coolcaesar at English Wikipedia // Wikimedia Commons
#21. Richard Beckwitt and Jonathan Jaffe (Lennar Corp.)
– 2021 salary: $34.0 million
– Median worker pay: $101,561 (335:1 ratio)
You may also like: Marijuana violations are taking truck drivers off the road, adding more supply chain disruptions
Owen Hoffmann // Getty Images
#20. James Gorman (Morgan Stanley)
– 2021 salary: $34.9 million
– Median worker pay: $137,069 (255:1 ratio)

JOSH EDELSON/POOL/AFP // Getty Images
#19. Gary Dickerson (Applied Materials Inc.)
– 2021 salary: $35.3 million
– Median worker pay: $109,304 (323:1 ratio)
John Lamparski // Getty Images
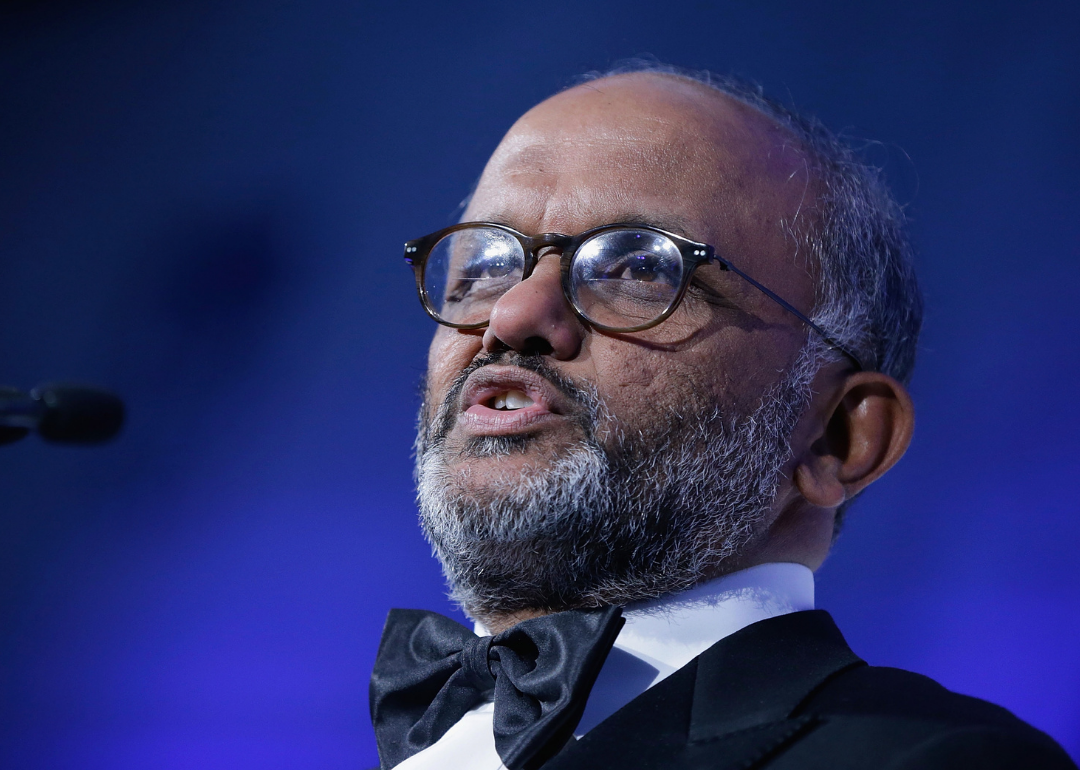
#18. Shantanu Narayen (Adobe Inc.)
– 2021 salary: $36.1 million
– Median worker pay: $165,733 (218:1 ratio)

Brandon Bell // Getty Images
#17. David Lesar (CenterPoint Energy Inc.)
– 2021 salary: $37.8 million
– Median worker pay: $103,170 (366:1 ratio)
Paul Morigi // Getty Images for Fortune // Getty Images
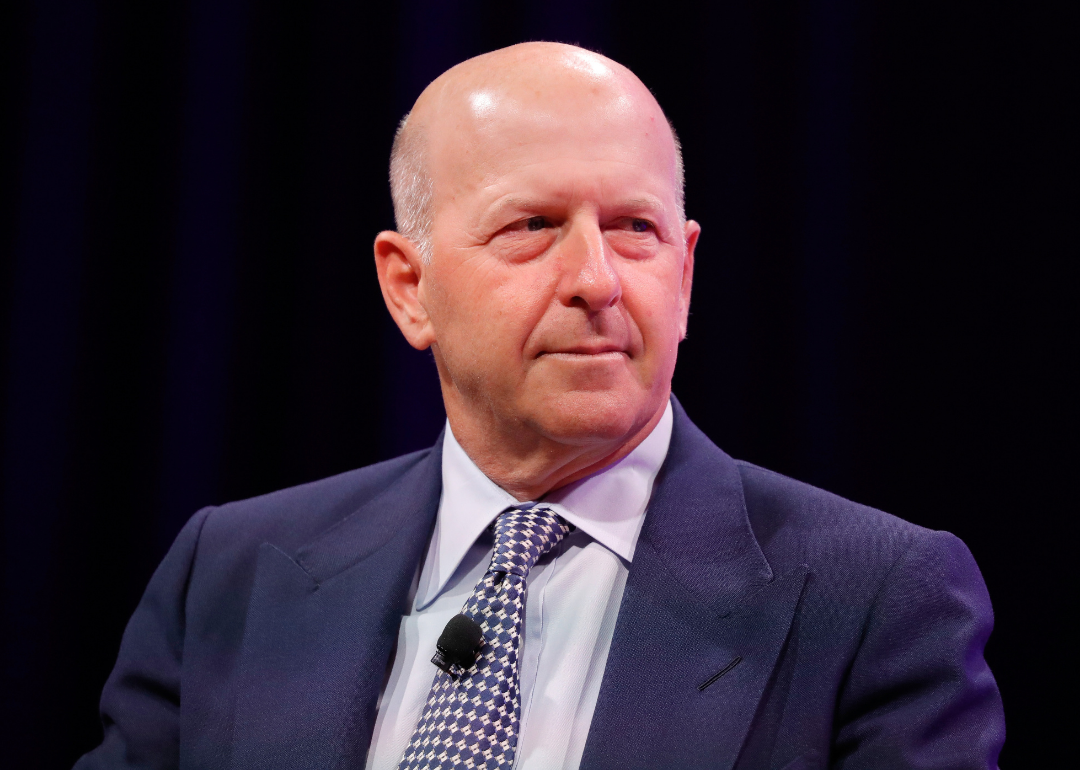
#16. David Solomon (The Goldman Sachs Group Inc.)
– 2021 salary: $39.5 million
– Median worker pay: $165,828 (238:1 ratio)
You may also like: Iconic car debuts from the year you were born

Roy Rochlin // Getty Images
#15. Josh Silverman (Etsy Inc.)
– 2021 salary: $40.6 million
– Median worker pay: $231,338 (175:1 ratio)
Ore Huiying // Getty Images for Netflix // Getty Images
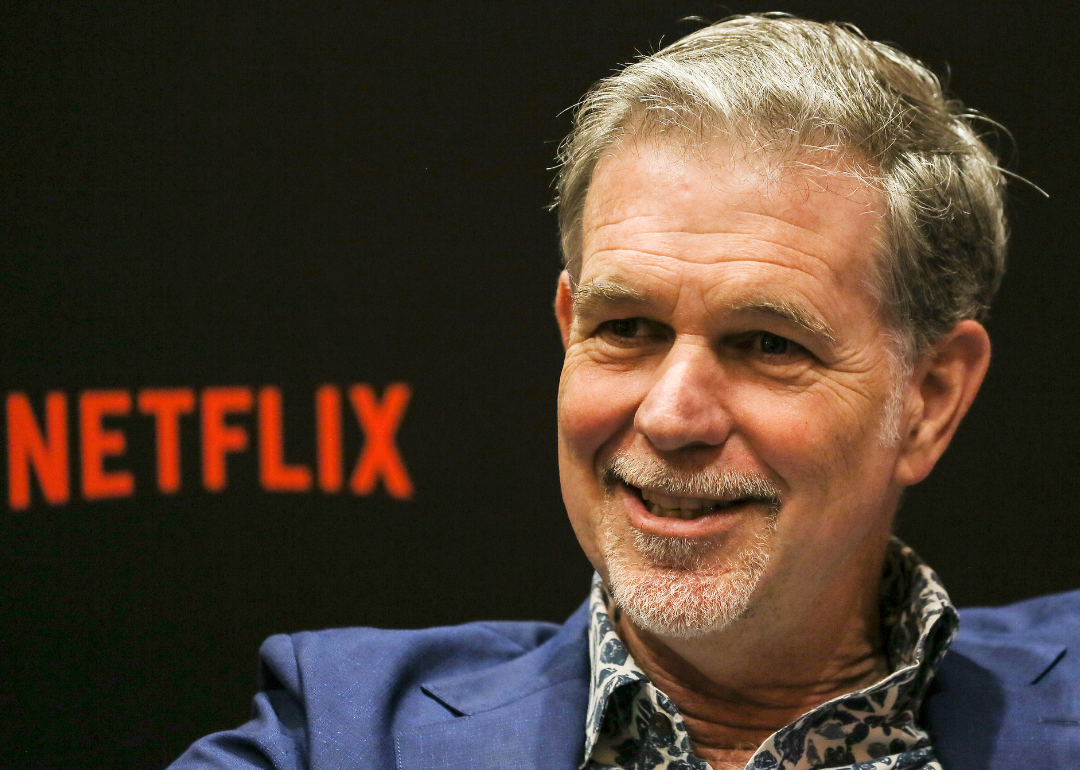
#14. Reed Hastings (Netflix Inc.)
– 2021 salary: $40.8 million
– Median worker pay: $201,743 (202:1 ratio)

Alex Wong // Getty Images
#13. Thomas Rutledge (Charter Communications Inc.)
– 2021 salary: $41.9 million
– Median worker pay: $60,007 (698:1 ratio)
Stephen Brashear // Getty Images
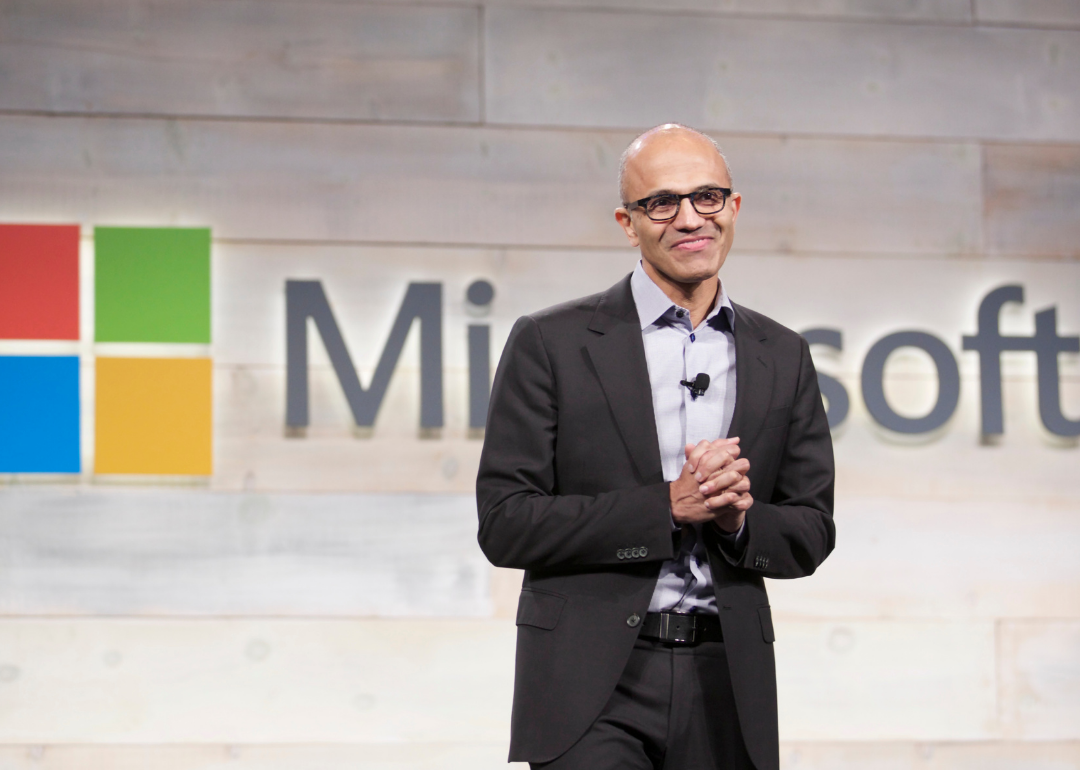
#12. Satya Nadella (Microsoft Corp.)
– 2021 salary: $49.9 million
– Median worker pay: $176,858 (282:1 ratio)

Kevin Dietsch // Getty Images
#11. Glenn Fogel (Booking Holdings Inc.)
– 2021 salary: $54.0 million
– Median worker pay: $58,005 (931:1 ratio)
You may also like: The industries where workers are quitting their jobs in droves
Keizers // Wikimedia Commons
#10. Ronald Clarke (FLEETCOR Technologies Inc.)
– 2021 salary: $57.9 million
– Median worker pay: $41,265 (1,404:1 ratio)

Ying Tang/NurPhoto // Getty Images
#9. Hock Tan (Broadcom Inc.)
– 2021 salary: $60.7 million
– Median worker pay: $247,541 (245:1 ratio)

John Wilcox/MediaNews Group/Boston Herald // Getty Images
#8. Jay Snowden (Penn National Gaming Inc.)
– 2021 salary: $65.9 million
– Median worker pay: $33,930 (1,942:1 ratio)

Patrick McMullan // Getty Images
#7. Fabrizio Freda (The Estee Lauder Companies Inc.)
– 2021 salary: $66.0 million
– Median worker pay: $33,586 (1,965:1 ratio)

World Economic Forum // Wikimedia Commons
#6. James Dimon (JPMorgan Chase & Co.)
– 2021 salary: $84.4 million
– Median worker pay: $92,112 (917:1 ratio)
You may also like: 50 women who broke barriers in the business world

Nathan Howard // Getty Images
#5. Timothy Cook (Apple Inc.)
– 2021 salary: $98.7 million
– Median worker pay: $68,254 (1,447:1 ratio)
Sundry Photography // Shutterstock
#4. William McDermott (ServiceNow Inc.)
– 2021 salary: $165.8 million
– Median worker pay: $233,859 (709:1 ratio)

Peter Gercke/picture alliance // Getty Images
#3. Patrick Gelsinger (Intel Corp.)
– 2021 salary: $178.6 million
– Median worker pay: $104,400 (1,711:1 ratio)

Michael M. Santiago // Getty Images
#2. Andrew Jassy (Amazon.com Inc.)
– 2021 salary: $212.7 million
– Median worker pay: $32,855 (6,474:1 ratio)

Imtiaz82 // Wikimedia Commons
#1. Peter Kern (Expedia Group Inc.)
– 2021 salary: $296.2 million
– Median worker pay: $102,270 (2,897:1 ratio)
You may also like: States where food stamps are used the most


You walk into a fast-food restaurant on your lunch break. You don’t see a cashier but instead a self-service kiosk, a technology that is becoming the new norm in eateries across the country. The kiosks usually offer customers a menu to scroll through and pictures of meals and specials with prompts to select their food and submit their payment in one place.
Self-service kiosks are big business. In fact, the market for self-service products is expected to grow from a $40.3 billion market value in 2022 to $63 billion by 2027, according to a report from BCC Research. Consumers do have mixed opinions about the kiosks, but about 3 out of 5 surveyed consumers reported that they were likely to use self-service kiosks, according to the National Restaurant Association. The technology, while expensive, can boost businesses’ bottom lines in the long run.
Task Group summarized the rise in digital ordering over the past couple of years, its acceptance among customers, and a cost analysis of adopting the technology.
Self-service kiosks—digital machines or display booths—are generally placed in high-traffic areas. They can be used for different reasons, including navigating a store or promoting a product. Interactive self-service kiosks in particular are meant for consumers to place orders with little to no assistance from employees.
The idea of kiosks isn’t new. The concept of self-service was first introduced in the 1880s when the first types of kiosks appeared as vending machines selling items like gum and postcards. In the present age of technology, the trend of self-service has only grown. Restaurants such as McDonald’s and Starbucks have already tried out cashierless technology.
From a business perspective, the kiosks offer a huge upside. While many employers are looking for workers, they’re having a hard time finding staff. In the midst of the COVID-19 pandemic, employers struggled with a severe employee shortage. Since then, the problem has continued. In 2022, the National Restaurant Association reported that 65% of restaurant operators didn’t have enough workers on staff to meet consumer demand. With labor shortages running rampant, cashierless technology could help restaurants fill in for the lack of human employees.
The initial investment for the kiosks can be high. The general cost per kiosk is difficult to quantify, with one manufacturer estimating a range of $1,500 to $20,000 per station. However, with the use of kiosks, restaurants may not need as many cashiers or front-end employees, instead reallocating workers’ time to other tasks.
In May 2022, the hourly mean wage for cashiers who worked in restaurants and other eating establishments was $12.99, according to the Bureau of Labor Statistics. Kiosks could cost less money than a cashier in the long run.
But how do the customers themselves feel about the growing trend? According to a Deloitte survey, 62% of respondents report that they were “somewhat likely” to order from a cashierless restaurant if given the chance to do so. The same survey reported that only 19% of respondents had experience with a cashierless restaurant.
What would it mean for society if restaurants did decide to go completely cashierless? Well, millions of positions would likely no longer be necessary. One report suggests 82% of restaurant positions could be replaced by robots, a prospect making automation appealing to owners who can’t find staff to hire.
Due to the ongoing labor shortage, employers have tried raising employee wages. Papa John’s, Texas Roadhouse, and Chipotle were among the restaurant companies that increased employee pay or offered bonuses in an attempt to hire and retain more workers. Meanwhile, some companies have decided to use technology to perform those jobs instead, so that they wouldn’t have to put effort into hiring or focus their existing staff on other roles.
Story editing by Ashleigh Graf and Jeff Inglis. Copy editing by Tim Bruns.
![]()

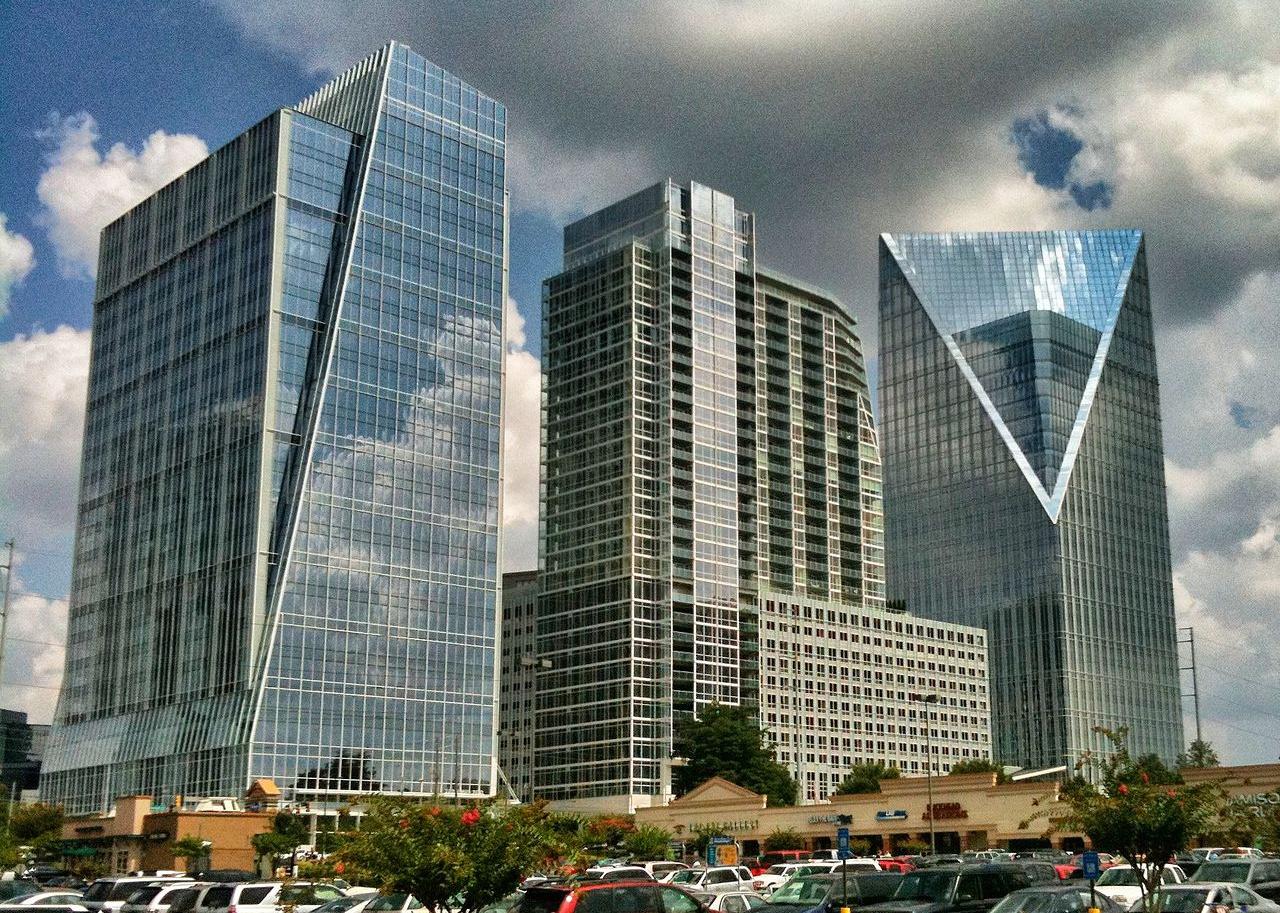
It’s well-documented that the surest, and often best, return on investments comes from playing the long game. But between stocks and real estate, which is the stronger bet?
To find out, financial planning firm Wealth Enhancement Group analyzed data from academic research, Standard and Poor’s, and Nareit to see how real estate compares to stocks as an investment.
Data going back to 1870 shows the well-established power of real estate as a powerful “long-run investment.” From 1870-2015, and after adjusting for inflation, real estate produced an average annual return of 7.05%, compared to 6.89% for equities. These findings, published in the 2019 issue of The Quarterly Journal of Economics, illustrate that stocks can deviate as much as 22% from their average, while housing only spreads out 10%. That’s because despite having comparable returns, stocks are inherently more volatile due to following the whims of the business cycle.
Real estate has inherent benefits, from unlocking cash flow and offering tax breaks to building equity and protecting investors from inflation. Investments here also help to diversify a portfolio, whether via physical properties or a real estate investment trust. Investors can track markets with standard resources that include the S&P CoreLogic Case-Shiller Home Price Indices, which tracks residential real estate prices; the Nareit U.S. Real Estate Index, which gathers data on the real estate investment trust, or REIT, industry; and the S&P 500, which tracks the stocks of 500 of the largest companies in the U.S.
High interest rates and a competitive market dampened the flurry of real-estate investments made in the last four years. The rise in interest rates equates to a bigger borrowing cost for investors, which can spell big reductions in profit margins. That, combined with the risk of high vacancies, difficult tenants, or hidden structural problems, can make real estate investing a less attractive option—especially for first-time investors.
Keep reading to learn more about whether real estate is a good investment today and how it stacks up against the stock market.
![]()
Wealth Enhancement Group
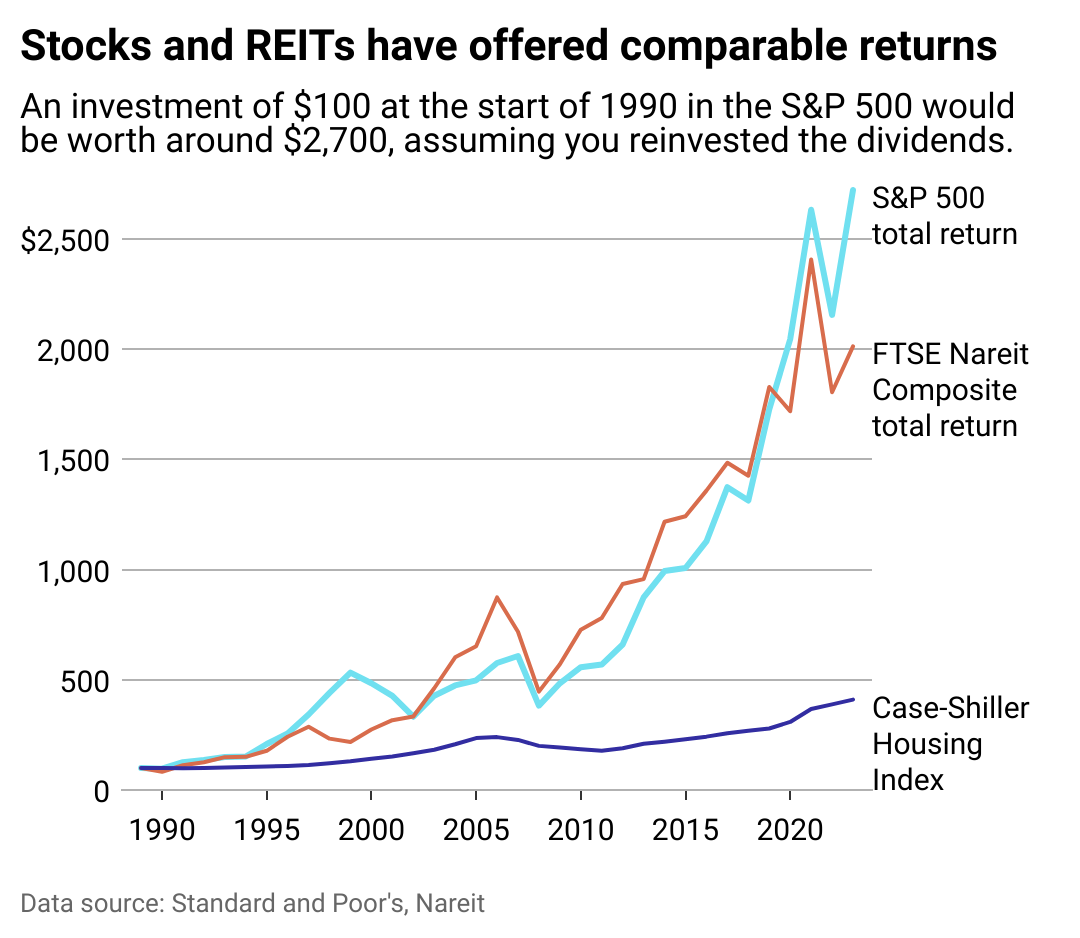
Stocks and housing have both done well
REITs can offer investors the stability of real estate returns without bidding wars or hefty down payments. A hybrid model of stocks and real estate, REITs allow the average person to invest in businesses that finance or own income-generating properties.
REITs delivered slightly better returns than the S&P 500 over the past 20-, 25-, and 50-year blocks. However, in the short term—the last 10 years, for instance—stocks outperformed REITs with a 12% return versus 9.5%, according to data compiled by The Motley Fool investor publication.
Whether a new normal is emerging that stocks will continue to offer higher REITs remains to be seen.
This year, the S&P 500 reached an all-time high, courtesy of investor enthusiasm in speculative tech such as artificial intelligence. However, just seven tech companies, dubbed “The Magnificent 7,” are responsible for an outsized amount of the S&P’s returns last year, creating worry that there may be a tech bubble.
While indexes keep a pulse on investment performance, they don’t always tell the whole story. The Case-Shiller Index only measures housing prices, for example, which leaves out rental income (profit) or maintenance costs (loss) when calculating the return on residential real estate investment.
Wealth Enhancement Group
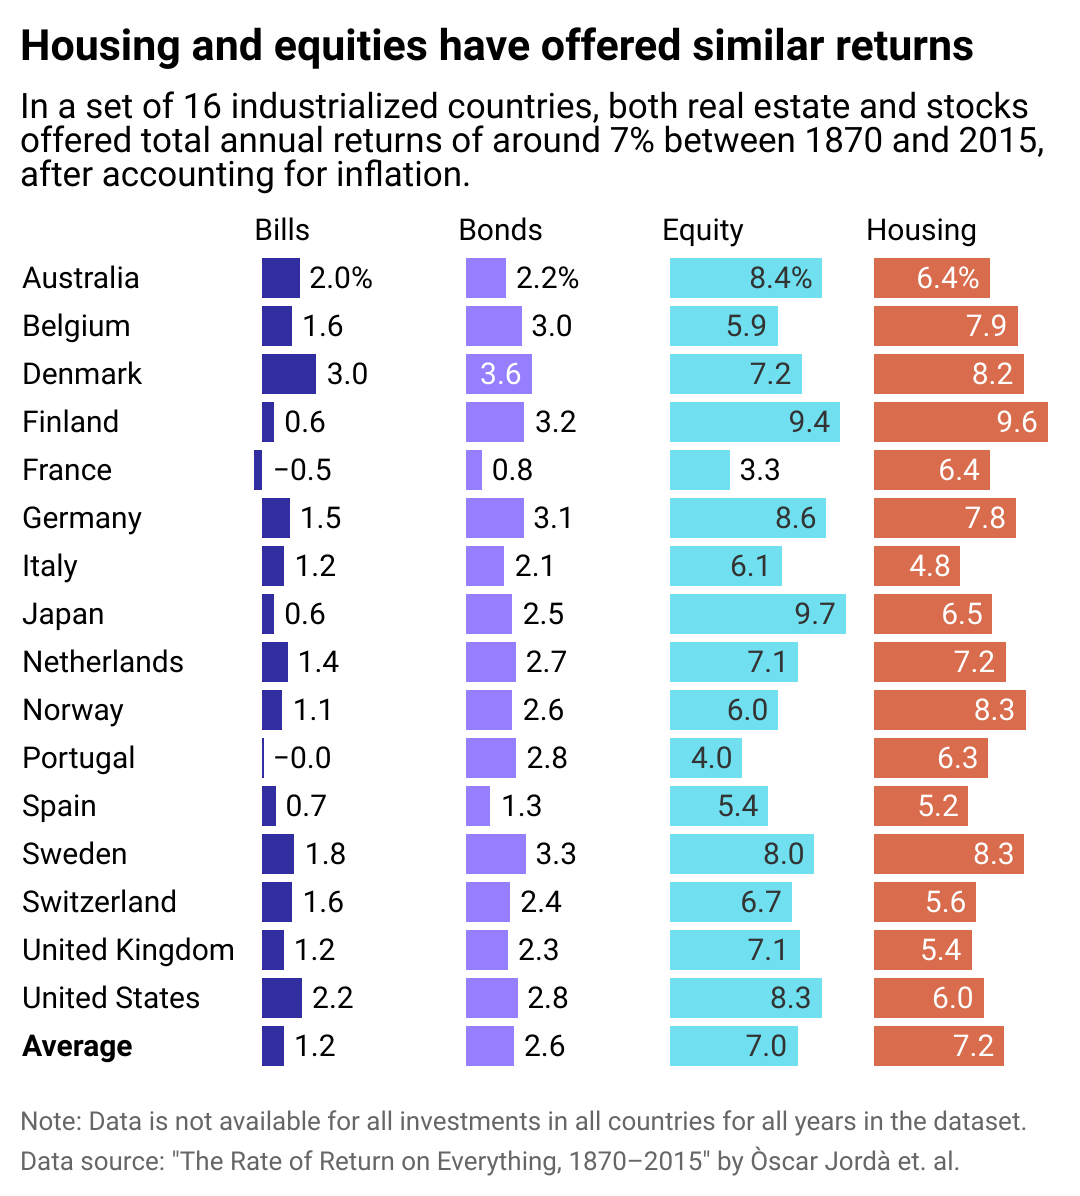
Housing returns have been strong globally too
Like its American peers, the global real estate market in industrialized nations offers comparable returns to the international stock market.
Over the long term, returns on stocks in industrialized nations is 7%, including dividends, and 7.2% in global real estate, including rental income some investors receive from properties. Investing internationally may have more risk for American buyers, who are less likely to know local rules and regulations in foreign countries; however, global markets may offer opportunities for a higher return. For instance, Portugal’s real estate market is booming due to international visitors deciding to move there for a better quality of life. Portugal’s housing offers a 6.3% return in the long term, versus only 4.3% for its stock market.
For those with deep enough pockets to stay in, investing in housing will almost always bear out as long as the buyer has enough equity to manage unforeseen expenses and wait out vacancies or slumps in the market. Real estate promises to appreciate over the long term, offers an opportunity to collect rent for income, and allows investors to leverage borrowed capital to increase additional returns on investment.
Above all, though, the diversification of assets is the surest way to guarantee a strong return on investments. Spreading investments across different assets increases potential returns and mitigates risk.
Story editing by Nicole Caldwell. Copy editing by Paris Close. Photo selection by Lacy Kerrick.
This story originally appeared on Wealth Enhancement Group and was produced and
distributed in partnership with Stacker Studio.
In today’s digital climate, consuming sports has never been easier. Thanks to a plethora of streaming sites, alternative broadcasts, and advancements to home entertainment systems, the average fan has myriad options to watch and learn about their favorite teams at the touch of a button—all without ever having to leave the couch.
As a result, more and more sports venues have committed to improving and modernizing their facilities and fan experiences to compete with at-home audiences. Consider using mobile ticketing and parking passes, self-service kiosks for entry and ordering food, enhanced video boards, and jumbotrons that supply data analytics and high-definition replays. These innovations and upgrades are meant to draw more revenue and attract various sponsored partners. They also deliver unique and convenient in-person experiences that rival and outmatch traditional ways of enjoying games.
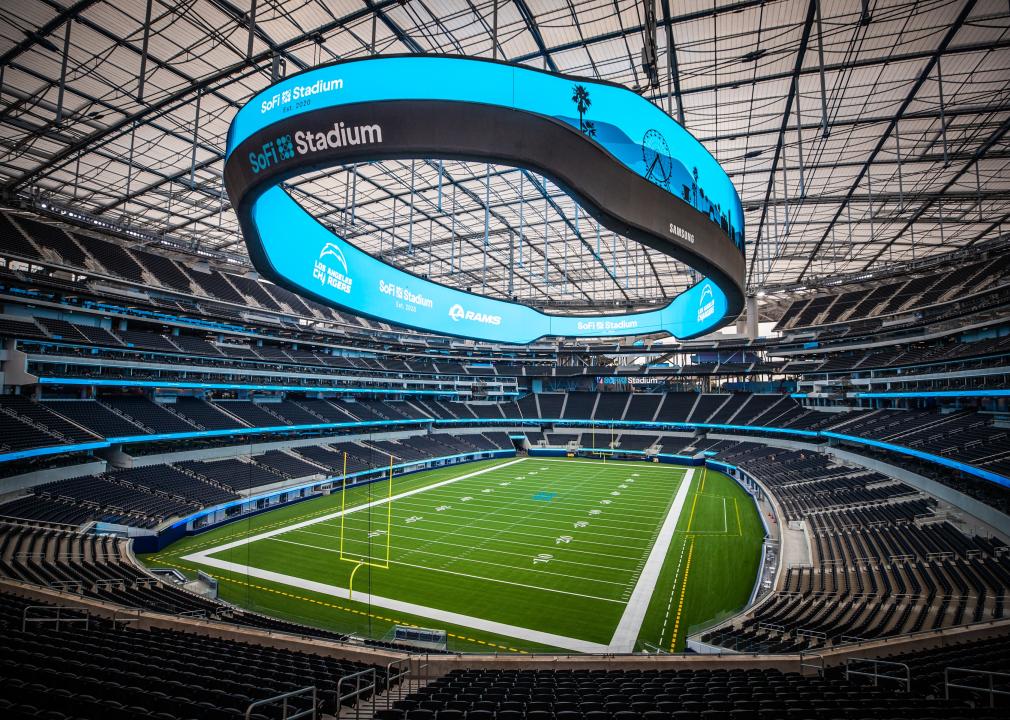
In Los Angeles, the Rams and Chargers’ SoFi Stadium has become the gold standard for football venues. It’s an architectural wonder with closer views, enhanced hospitality, and a translucent roof that cools the stadium’s internal temperature.
The Texas Rangers’ ballpark, Globe Life Field, added field-level suites and lounges that resemble the look and feel of a sports bar. Meanwhile, the Los Angeles Clippers are building a new arena (in addition to retail space, team offices, and an outdoor public plaza) that will seat 18,000 people and feature a fan section called The Wall, which will regulate attire and rooting interest.
It’s no longer acceptable to operate with old-school facilities and technology. Just look at Commanders Field (formerly FedExField), home of the Washington Commanders, which has faced criticism for its faulty barriers, leaking ceilings, poor food options, and long lines. Understandably, the team has been attempting to find a new location to build a state-of-the-art stadium and keep up with the demand for high-end amenities.
As more organizations audit their stadiums and arenas and keep up with technological innovations, Uniqode compiled a list of the latest tech advancements to coax—and keep—fans inside venues.
![]()
Jeff Gritchen/MediaNews Group/Orange County Register // Getty Images
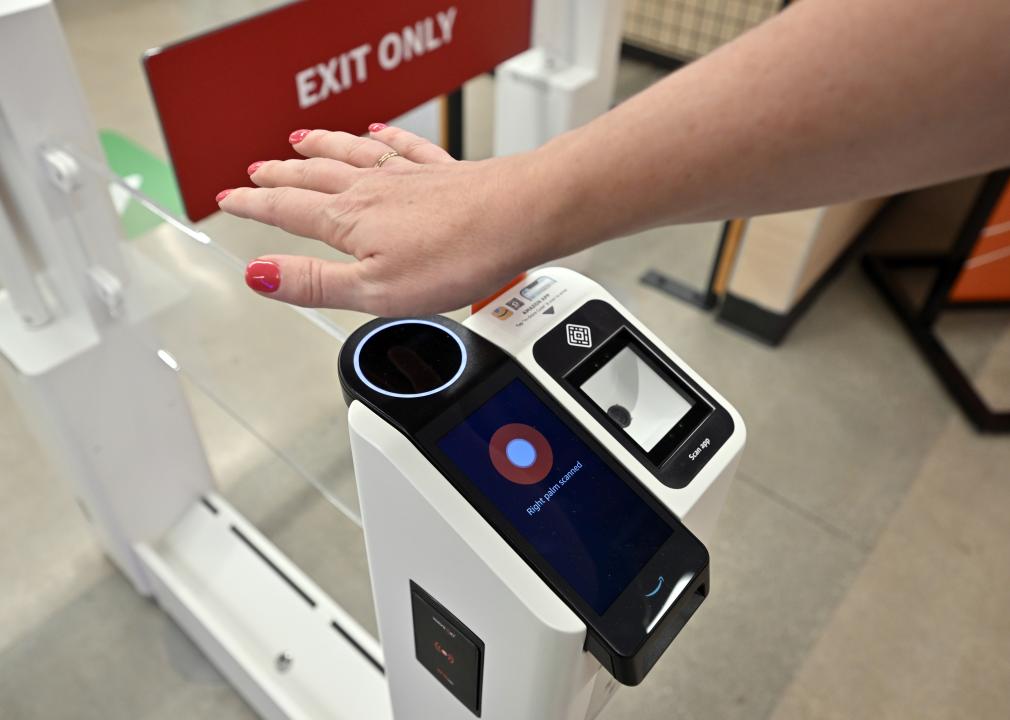
Just Walk Out technology
After successfully installing its first cashierless grocery store in 2020, Amazon has continued to put its tracking technology into practice.
In 2023, the Seahawks incorporated Just Walk Out technology at various merchandise stores throughout Lumen Field, allowing fans to purchase items with a swipe and scan of their palms.
The radio-frequency identification system, which involves overhead cameras and computer vision, is a substitute for cashiers and eliminates long lines.
RFID is now found in a handful of stadiums and arenas nationwide. These stores have already curbed checkout wait times, eliminated theft, and freed up workers to assist shoppers, according to Jon Jenkins, vice president of Just Walk Out tech.
Billie Weiss/Boston Red Sox // Getty Images
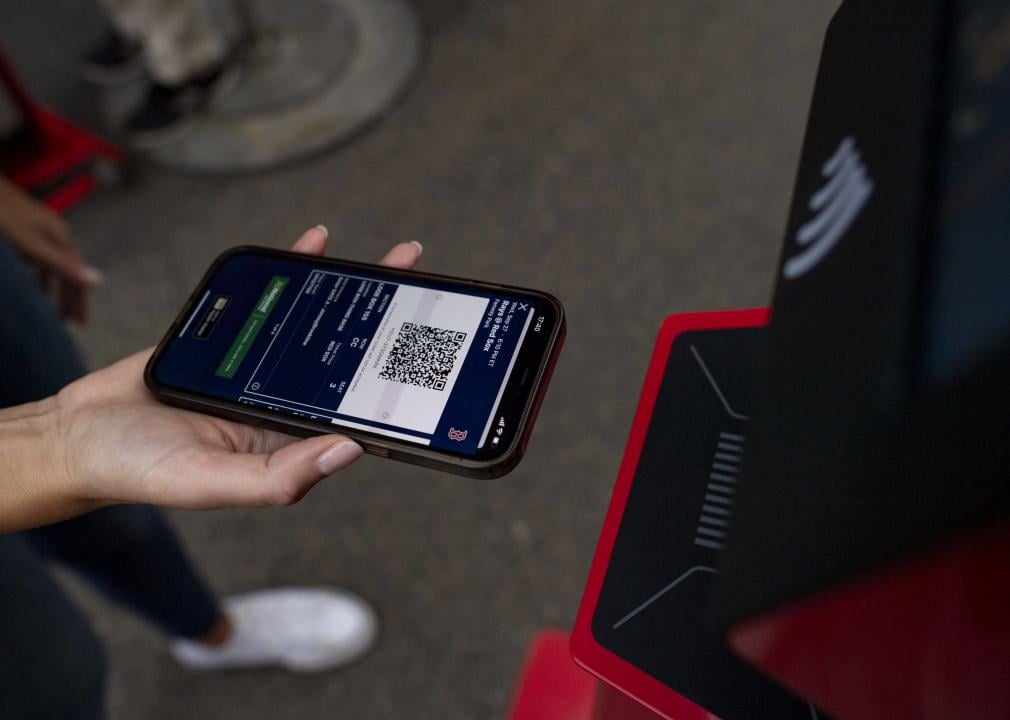
Self-serve kiosks
In the same vein as Amazon’s self-scanning technology, self-serve kiosks have become a more integrated part of professional stadiums and arenas over the last few years. Some of these function as top-tier vending machines with canned beers and nonalcoholic drinks, shuffling lines quicker with virtual bartenders capable of spinning cocktails and mixed drinks.
The kiosks extend past beverages, as many college and professional venues have started using them to scan printed and digital tickets for more efficient entrance. It’s an effort to cut down lines and limit the more tedious aspects of in-person attendance, and it’s led various competing kiosk brands to provide their specific conveniences.

Kyle Rivas // Getty Images
Mobile ordering
Is there anything worse than navigating the concourse for food and alcohol and subsequently missing a go-ahead home run, clutch double play, or diving catch?
Within the last few years, more stadiums have eliminated those worries thanks to contactless mobile ordering. Fans can select food and drink items online on their phones to be delivered right to their seats. Nearly half of consumers said mobile app ordering would influence them to make more restaurant purchases, according to a 2020 study at PYMNTS. Another study showed a 22% increase in order size.
Many venues, including Yankee Stadium, have taken notice and now offer personalized deliveries in certain sections and established mobile order pick-up zones throughout the ballpark.

Darrian Traynor // Getty Images
QR codes at seats
Need to remember a player’s name? Want to look up an opponent’s statistics at halftime? The team at Digital Seat Media has you covered.
Thus far, the company has added seat tags to more than 50 venues—including two NFL stadiums—with QR codes to promote more engagement with the product on the field. After scanning the code, fans can access augmented reality features, look up rosters and scores, participate in sponsorship integrations, and answer fan polls on the mobile platform.
Boris Streubel/Getty Images for DFL // Getty Images
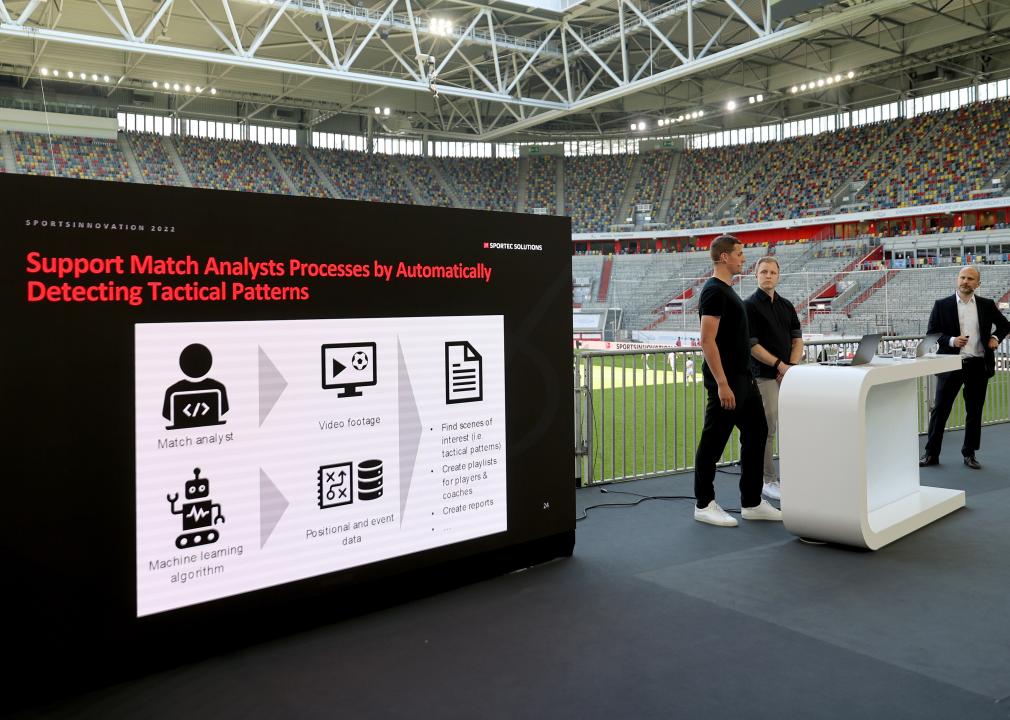
Real-time data analytics and generative AI
As more venues look to reinvigorate the in-stadium experience, some have started using generative artificial intelligence and real-time data analytics. Though not used widely yet, generative AI tools can create new content—text, imagery, or music—in conjunction with the game, providing updates, instant replays, and location-based dining suggestions
Last year, the Masters golf tournament even began including AI score projections in its mobile app. Real-time data is streamlining various stadium pitfalls, allowing operation managers to monitor staffing issues at busy food spots, adjust parking flows, and alert custodians to dirty or damaged bathrooms. The data also helps with security measures. Open up an app at a venue like the Honda Center in Anaheim, California, and report safety issues or belligerent fans to help better target disruptions and preserve an enjoyable experience.
Story editing by Nicole Caldwell. Copy editing by Paris Close. Photo selection by Lacy Kerrick.
This story originally appeared on Uniqode and was produced and
distributed in partnership with Stacker Studio.
-

 Business5 months ago
mesh conference goes deep on AI, with experts focusing in on training, ethics, and risk
-

 Business4 months ago
Skill-based hiring is the answer to labour shortages, BCG report finds
-

 Events3 months ago
The Northern Lights Technology & Innovation Forum comes to Calgary next month
-

 People4 months ago
How connected technologies trim rework and boost worker safety in hands-on industries
-

 Events6 months ago
Top 5 tech and digital transformation events to wrap up 2023