
Business
5 charts that show how productivity levels vary by state

The COVID-19 pandemic has driven an increase in productivity nationwide, even if that rise has been uneven from state to state.
ClickUp used data from the Bureau of Labor Statistics to compare productivity levels by state, based on business locations. The analysis looks closely at relationships between productivity, pay, and hours worked.
Economists and institutions have understood human beings as important elements in business operations since Adam Smith first proposed defining the concept of “human capital” in the late 1700s.
How many hours people work can be measured or estimated, and the total number of goods and services created in every hour of work per person is considered a measure of “productivity,” or the efficiency with which humans make new things in pursuit of economic gain.
Studies have shown since the 1950s that human capital, as much as money itself, can drive economic growth for entire nations of people.
Workers are, of course, much more than just an asset on a vehicle assembly line or an attendant on a commercial airplane—they are also individuals who have families, passions, and lives outside of the jobs they perform.
The COVID-19 pandemic laid bare Americans’ modern struggle to balance those two worlds. Working at home or in risky work environments, people discovered newfound leverage in an economy where workers were in high demand. Many workers began seeking more job flexibility and compensation or switched jobs.
As measured by economists today, productivity is a human force that has only ever increased. That’s because people incorporate new technology and innovation, allowing them to produce goods and services more efficiently. And the U.S. has been consistent in bringing about technological advancements over the last several decades. Whether the private sector has aptly leveraged them is a matter of debate.
Because of this fact, examining the change in productivity from year to year is more valuable than simply acknowledging the long-accepted trend that technological advancement has only caused humans to be more productive over time.
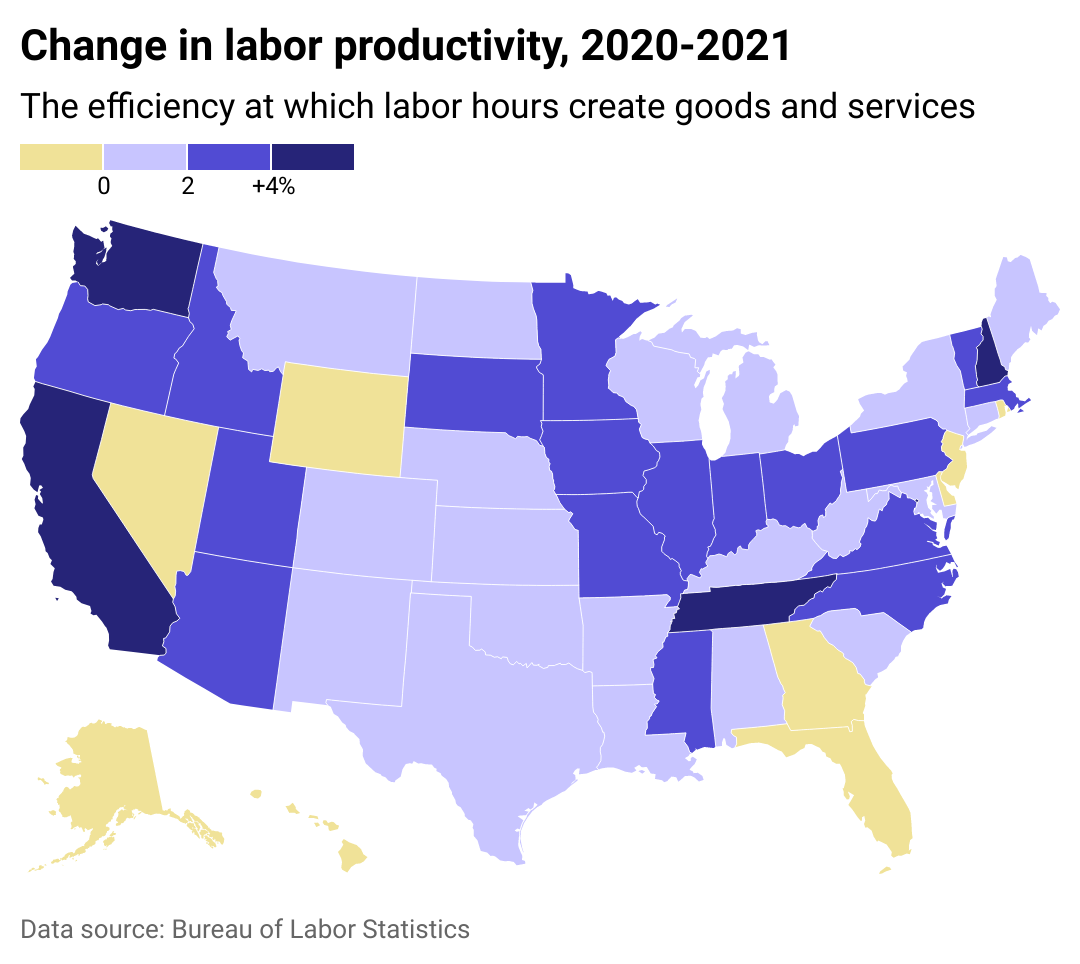
So just how much more value did workers create per hour in 2021 compared with 2020? Nationwide, labor productivity among private sector workers increased by 1.9% in 2021, or about on par with the last several decades. According to the BLS, hours worked grew 5.4% from 2020 to 2021—the most significant year-to-year growth in decades, though the 2021 figures still did not exceed the total hours worked in 2019.
That’s partly due to 2020 being a historically disruptive year for work. The spreading contagion and a lack of vaccines to prevent death meant in-person business operations were dangerous and even potentially deadly, especially for older workers.
![]()
ClickUp
Most states increased labor productivity, but a few saw decreases
Areas that are home to fast-growing businesses can be evidence of more rapid productivity growth, according to the Brookings Institute. This information could help explain why California and Washington, home to much of the country’s tech presence, saw significant increases in productivity over the first two years of the COVID-19 pandemic.
States not traditionally viewed as tech hubs also benefited from dramatic swings in domestic migration that saw urban-dwelling white-collar Americans moving from the crowded, expensive coasts to more affordable states. Tennessee has seen its tech sector blossom in recent years—a trend bolstered by pandemic pressures.
ClickUp
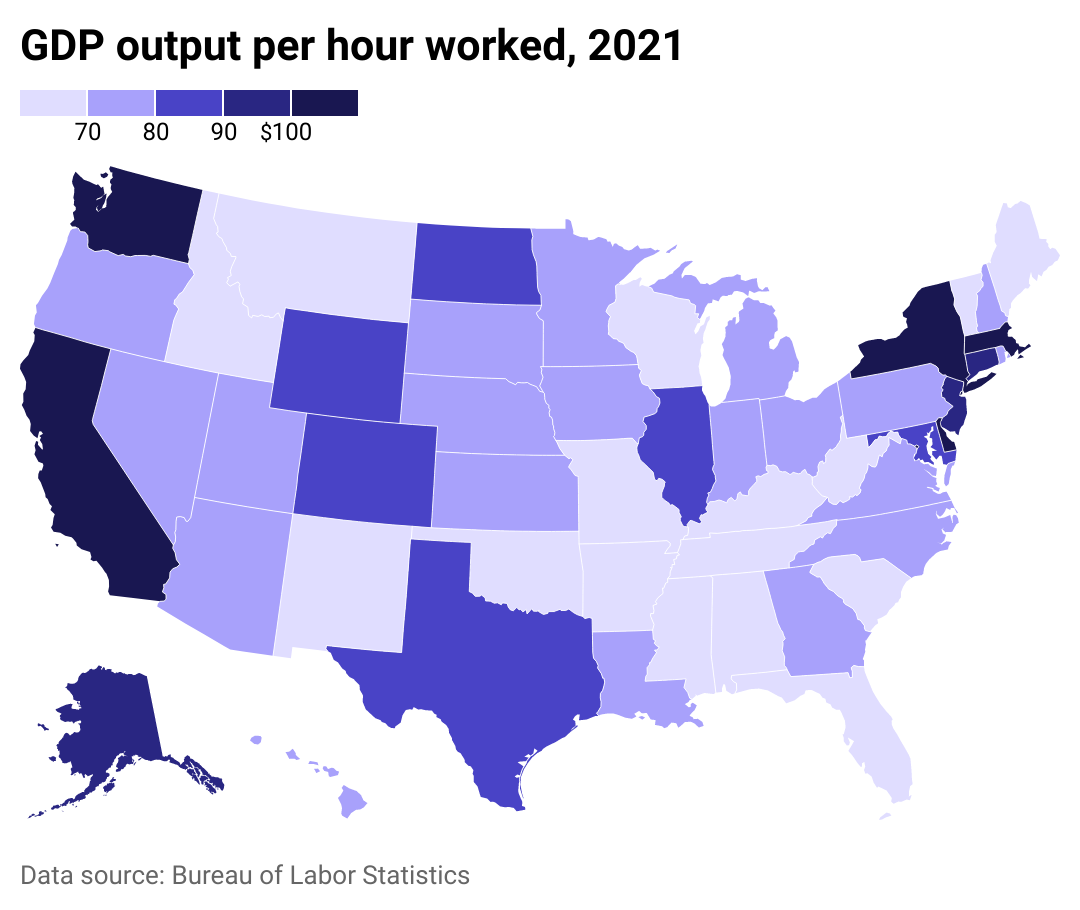
GDP contributions ranged from $58 to $118 per hour
The booming economies of California, New York, Massachusetts, and Washington saw workers creating the most value per hour worked. These are states with widespread internet availability that allows for leveraging the latest technological developments in software, as well as burgeoning populations.
The Midwest has trailed all other regions of the country since 2007 in terms of productivity gains, according to BLS analysis.
ClickUp
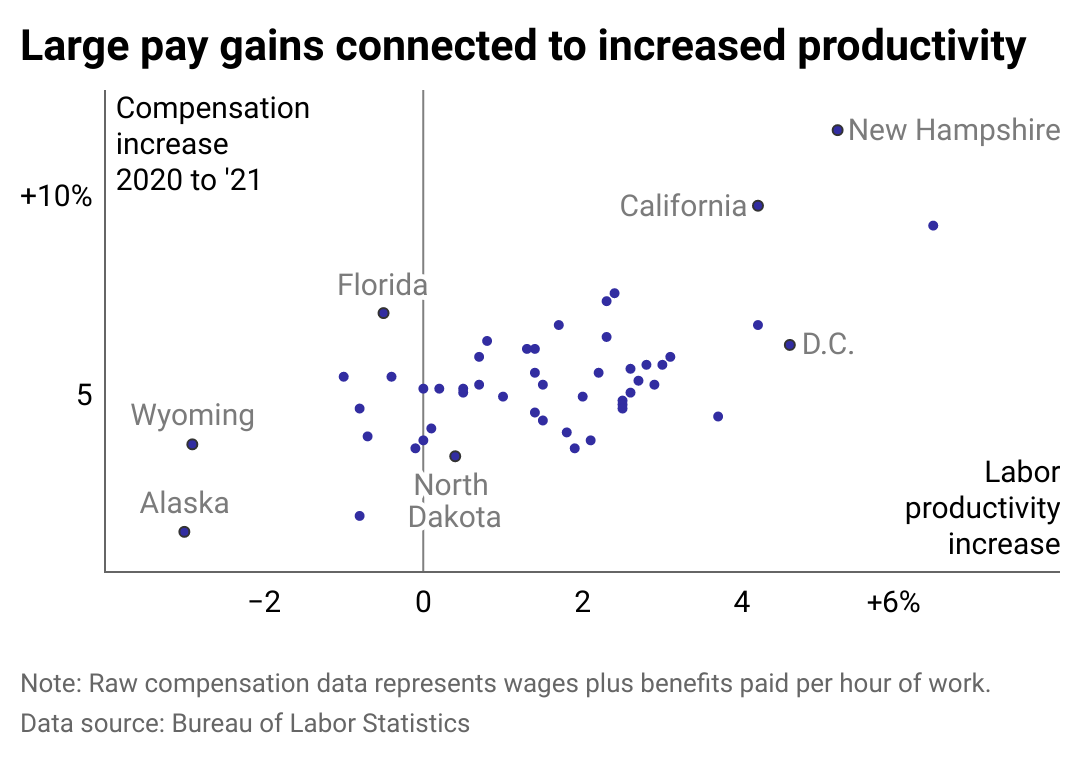
Productivity grew most where compensation surged
There is a strong correlation between increased pay and increases in productivity. Researchers have found that companies that raise pay, including in response to minimum-wage increases, create a greater sense of attachment between workers and the employer.
California, New Hampshire, and Washington D.C., all saw compensation rise more than 5% in 2021 over 2020 levels. Those places also have some of the highest living costs in the nation. Florida, home to a large aging population, also saw significant wage gains relative to other states, but those did not translate to increases in productivity.
ClickUp
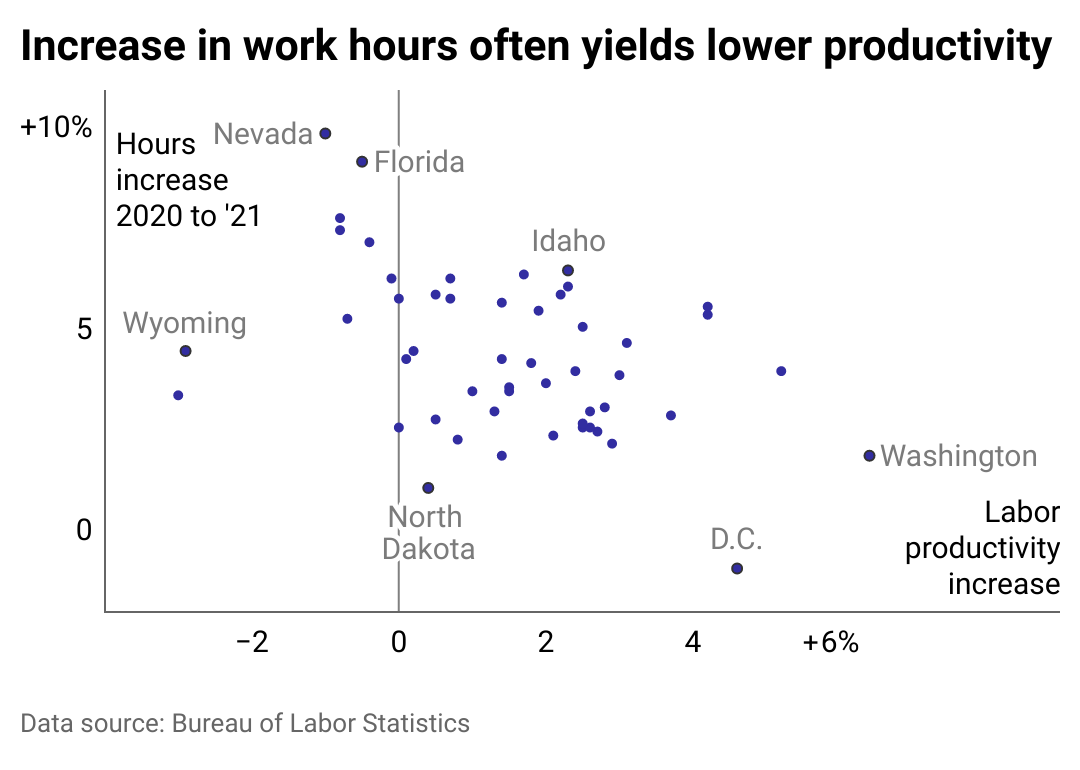
That trend didn’t hold true for increasing hours
Working longer hours doesn’t necessarily mean producing more value for a firm, an employee, or the economy. Numbers bear this out: Workers in states including Nevada, Wyoming, and Florida spent longer hours working and actually saw a decline in productivity as a result.
In Washington and Washington D.C., workers made strides in efficiency, seeing 4% or more year-over-year growth in productivity, according to BLS data.
Some white-collar workers found the shift to remote work during the pandemic meant more hours working because their personal smartphones could receive work communications long after the official eight-hour workday ended. The majority, however, have said it helped them find a better work-life balance, according to a Pew Research poll conducted in January 2022.
ClickUp
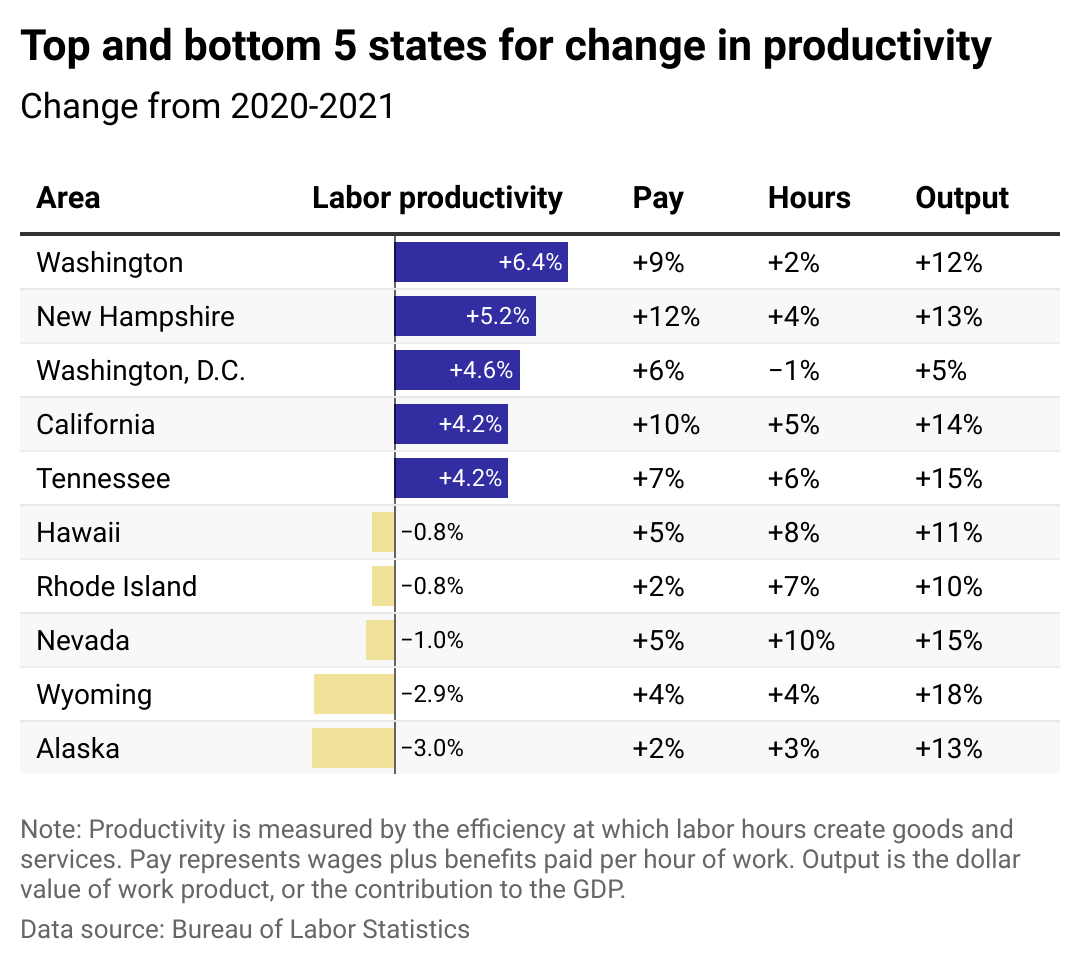
Rounding up the top and bottom performers
The bottom line is that worker output increased over the year as demand skyrocketed for goods while Americans continued to avoid service industry businesses like live events and Nevada’s casinos.
Some state economies were in a better position to benefit from that shift in demand. States like Wyoming and Alaska, however, saw productivity suffer. They also saw wages that, despite increasing, trailed growth rates in states with highly skilled workforces like New Hampshire and Washington.
This story originally appeared on ClickUp and was produced and
distributed in partnership with Stacker Studio.


Inflation has cooled substantially, but Americans are still feeling the strain of sky-high prices. Consumers have to spend more on the same products, from the grocery store to the gas pump, than ever before.
Increased import costs are part of the problem. The U.S. is the largest goods importer in the world, bringing in $3.2 trillion in 2022. Import costs rose dramatically in 2021 and 2022 due to shipping constraints, world events, and other supply chain interruptions and cost pressures. At the June 2022 peak, import costs for all commodities were up 18.6% compared to January 2020.
While import costs have since fallen most months—helping to lower inflation—they remain nearly 12% above what they were in 2020. And beginning in 2024, import costs began to rise again, with January seeing the highest one-month increase since March 2022.
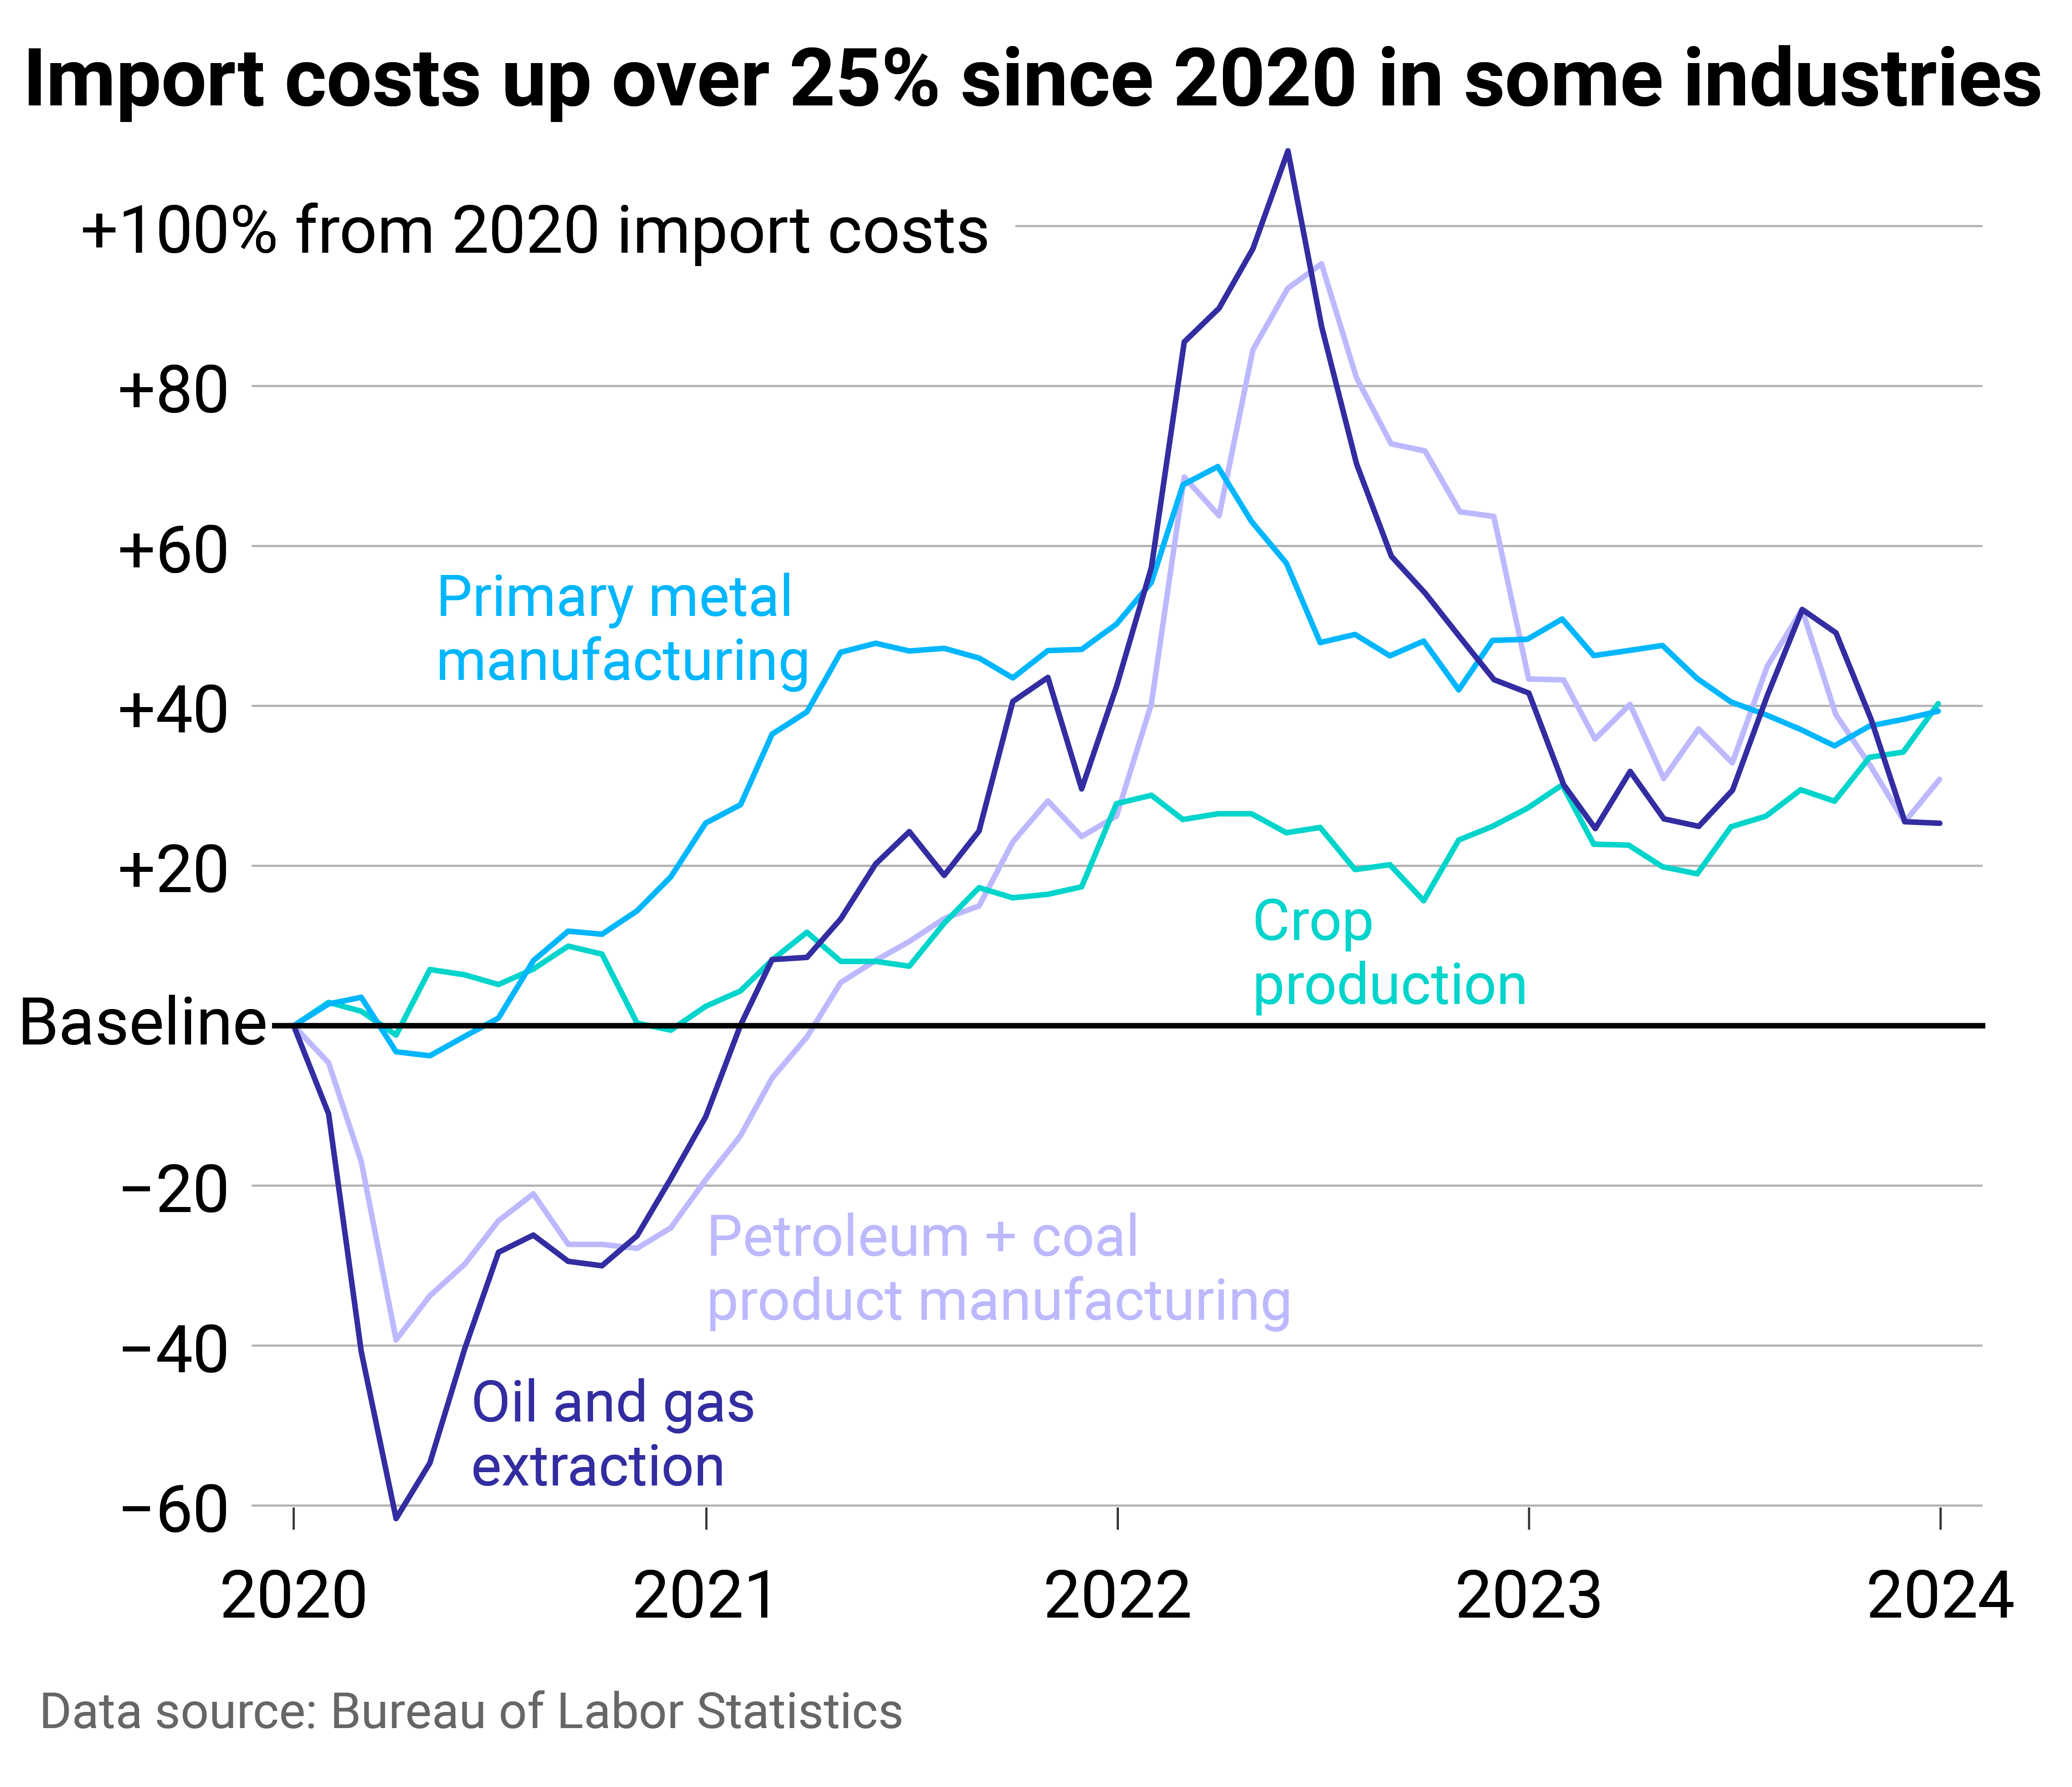
Machinery Partner used Bureau of Labor Statistics data to identify the soaring import costs that have translated to higher costs for Americans. Imports in a few industries have had an outsized impact, helping drive some of the overall spikes. Crop production, primary metal manufacturing, petroleum and coal product manufacturing, and oil and gas extraction were the worst offenders, with costs for each industry remaining at least 20% above 2020.
![]()
Machinery Partner
Imports related to crops, oil, and metals are keeping costs up
At the mid-2022 peak, import costs related to oil, gas, petroleum, and coal products had the highest increases, doubling their pre-pandemic costs. Oil prices went up globally as leaders anticipated supply disruptions from the conflict in Ukraine. The U.S. and other allied countries put limits on Russian revenues from oil sales through a price cap of oil, gas, and coal from the country, which was enacted in 2022.
This activity around the world’s second-largest oil producer pushed prices up throughout the market and intensified fluctuations in crude oil prices. Previously, the U.S. had imported hundreds of thousands of oil barrels from Russia per day, making the country a leading source of U.S. oil. In turn, the ban affected costs in the U.S. beyond what occurred in the global economy.
Americans felt this at the pump—with gasoline prices surging 60% for consumers year-over-year in June 2022 and remaining elevated to this day—but also throughout the economy, as the entire supply chain has dealt with higher gas, oil, and coal prices.
Some of the pressure from petroleum and oil has shifted to new industries: crop production and primary metal manufacturing. In each of these sectors, import costs in January were up about 40% from 2020.
Primary metal manufacturing experienced record import price growth in 2021, which continued into early 2022. The subsequent monthly and yearly drops have not been substantial enough to bring costs down to pre-COVID levels. Bureau of Labor Statistics reporting shows that increasing alumina and aluminum production prices had the most significant influence on primary metal import prices. Aluminum is widely used in consumer products, from cars and parts to canned beverages, which in turn inflated rapidly.
Aluminum was in short supply in early 2022 after high energy costs—i.e., gas—led to production cuts in Europe, driving aluminum prices to a 13-year high. The U.S. also imposes tariffs on aluminum imports, which were implemented in 2018 to cut down on overcapacity and promote U.S. aluminum production. Suppliers, including Canada, Mexico, and European Union countries, have exemptions, but the tax still adds cost to imports.
U.S. agricultural imports have expanded in recent decades, with most products coming from Canada, Mexico, the EU, and South America. Common agricultural imports include fruits and vegetables—especially those that are tropical or out-of-season—as well as nuts, coffee, spices, and beverages. Turmoil with Russia was again a large contributor to cost increases in agricultural trade, alongside extreme weather events and disruptions in the supply chain. Americans felt these price hikes directly at the grocery store.
The U.S. imports significantly more than it exports, and added costs to those imports are felt far beyond its ports. If import prices continue to rise, overall inflation would likely follow, pushing already high prices even further for American consumers.
Story editing by Shannon Luders-Manuel. Copy editing by Kristen Wegrzyn.
This story originally appeared on Machinery Partner and was produced and
distributed in partnership with Stacker Studio.

Nearly every state requires drivers to carry car insurance, but the laws vary, and many factors affect the cost of coverage.
Some are controllable, at least to degrees: the type of car you have and your credit history. Some are not: your age and gender. Your marital status, place of residence, and claims history are among the other variables that go into it.
Across the United States, premiums are soaring, rising 20% year over year and increasing six times faster than consumer prices overall as of December 2023, CBS reported. Last September, CNN noted that car insurance rates jumped more in the previous year than they had since 1976.
CBS pointed to many potential reasons for these increases in prices. Coronavirus pandemic-era issues have made buying, fixing, and replacing vehicles costlier. Extreme weather events caused by climate change also damage more vehicles, while insurance companies are increasing their business costs. Severe and more frequent crashes are to blame as well, CNN reported.
On top of these, local factors such as population density, the number of uninsured drivers, and the frequency of insurance claims all affect premiums, which can lead motorists to change or switch their coverage, use other modes of transportation, or even alter decisions about when to buy a vehicle or what to look for.
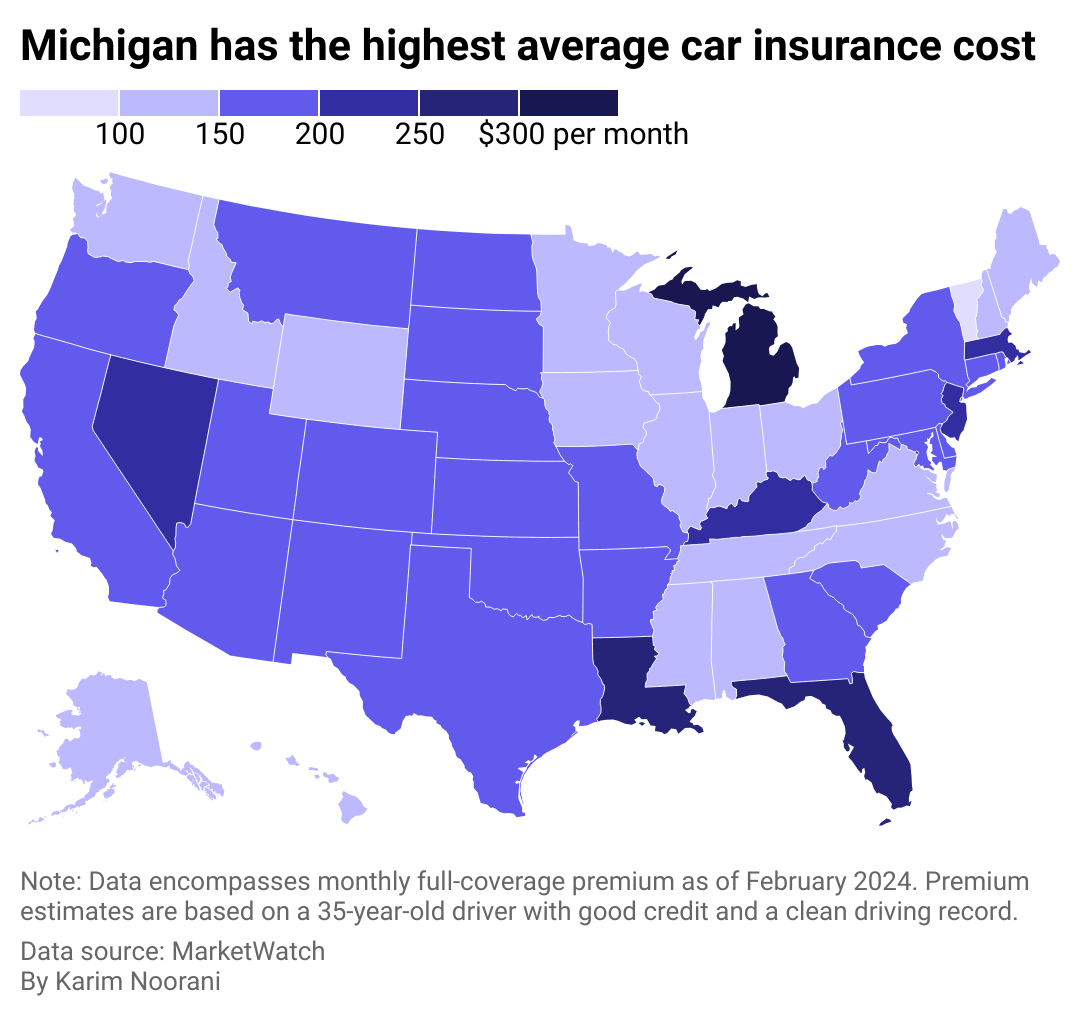
To see how geography affects cost, Cheap Insurance mapped the states where people pay the most in car insurance premiums using MarketWatch data. Premium estimates were based on full-coverage car insurance for a 35-year-old driver with good credit and a clean driving record. Data accurate as of February 2024.
![]()
Cheap Insurance
Americans pay $167 per month on average for full-coverage insurance
There are common denominators among the five states where it’s most expensive to have car insurance: Michigan, Florida, Louisiana, Nevada, and Kentucky. Washington D.C. is another pricey locale, ranking #4 overall.
Three of these six are no-fault jurisdictions and require additional coverage beyond coverage to pay for medical costs. Michigan notably calls for $250,000 in personal injury protection (though people with Medicaid and Medicare may qualify for lower limits), $1 million in personal property insurance for damage done by your car in Michigan, and residual bodily injury and property damage liability that starts at $250,000 for a person harmed in an accident.
Other commonalities between these states include high urban population densities. At least 9 in 10 people in Nevada, Florida, and Washington D.C. live in cities and urban areas, which leads to more crashes and thefts and high rates of uninsured drivers and lawsuits. Additionally, Louisiana, Florida, and Kentucky rank #5, #8, and #10, respectively, in motor vehicle crash deaths per 100 million vehicle miles traveled in 2021 based on Department of Transportation data analyzed by the Insurance Institute for Highway Safety.

Canva
#5. Kentucky
– Monthly full-coverage insurance: $210
– Monthly liability insurance: $57

Canva
#4. Nevada
– Monthly full-coverage insurance: $232
– Monthly liability insurance: $107

Canva
#3. Louisiana
– Monthly full-coverage insurance: $253
– Monthly liability insurance: $77

Canva
#2. Florida
– Monthly full-coverage insurance: $270
– Monthly liability insurance: $115

Canva
#1. Michigan
– Monthly full-coverage insurance: $304
– Monthly liability insurance: $113
Story editing by Carren Jao. Copy editing by Paris Close. Photo selection by Lacy Kerrick.
This story originally appeared on Cheap Insurance and was produced and
distributed in partnership with Stacker Studio.
Business
How businesses can protect themselves from the rising threat of deepfakes
Dive into the world of deepfakes and explore the risks, strategies and insights to fortify your organization’s defences

Dave is a journalist whose work has appeared in more than 100 media outlets around the world, including BBC, National Post, Washington Times, Globe and Mail, New York Times, Baltimore Sun.
-

 Events6 months ago
Top 5 tech and digital transformation events to wrap up 2023
-

 Business4 months ago
mesh conference goes deep on AI, with experts focusing in on training, ethics, and risk
-

 Business4 months ago
Skill-based hiring is the answer to labour shortages, BCG report finds
-

 People3 months ago
How connected technologies trim rework and boost worker safety in hands-on industries
-

 Events3 months ago
The Northern Lights Technology & Innovation Forum comes to Calgary next month