
Business
Best Midwest small towns to live in

The Midwest may be best known for its big cities of Chicago, Detroit, and Indianapolis, but prospective homebuyers may want to turn their attention to the region’s small towns.
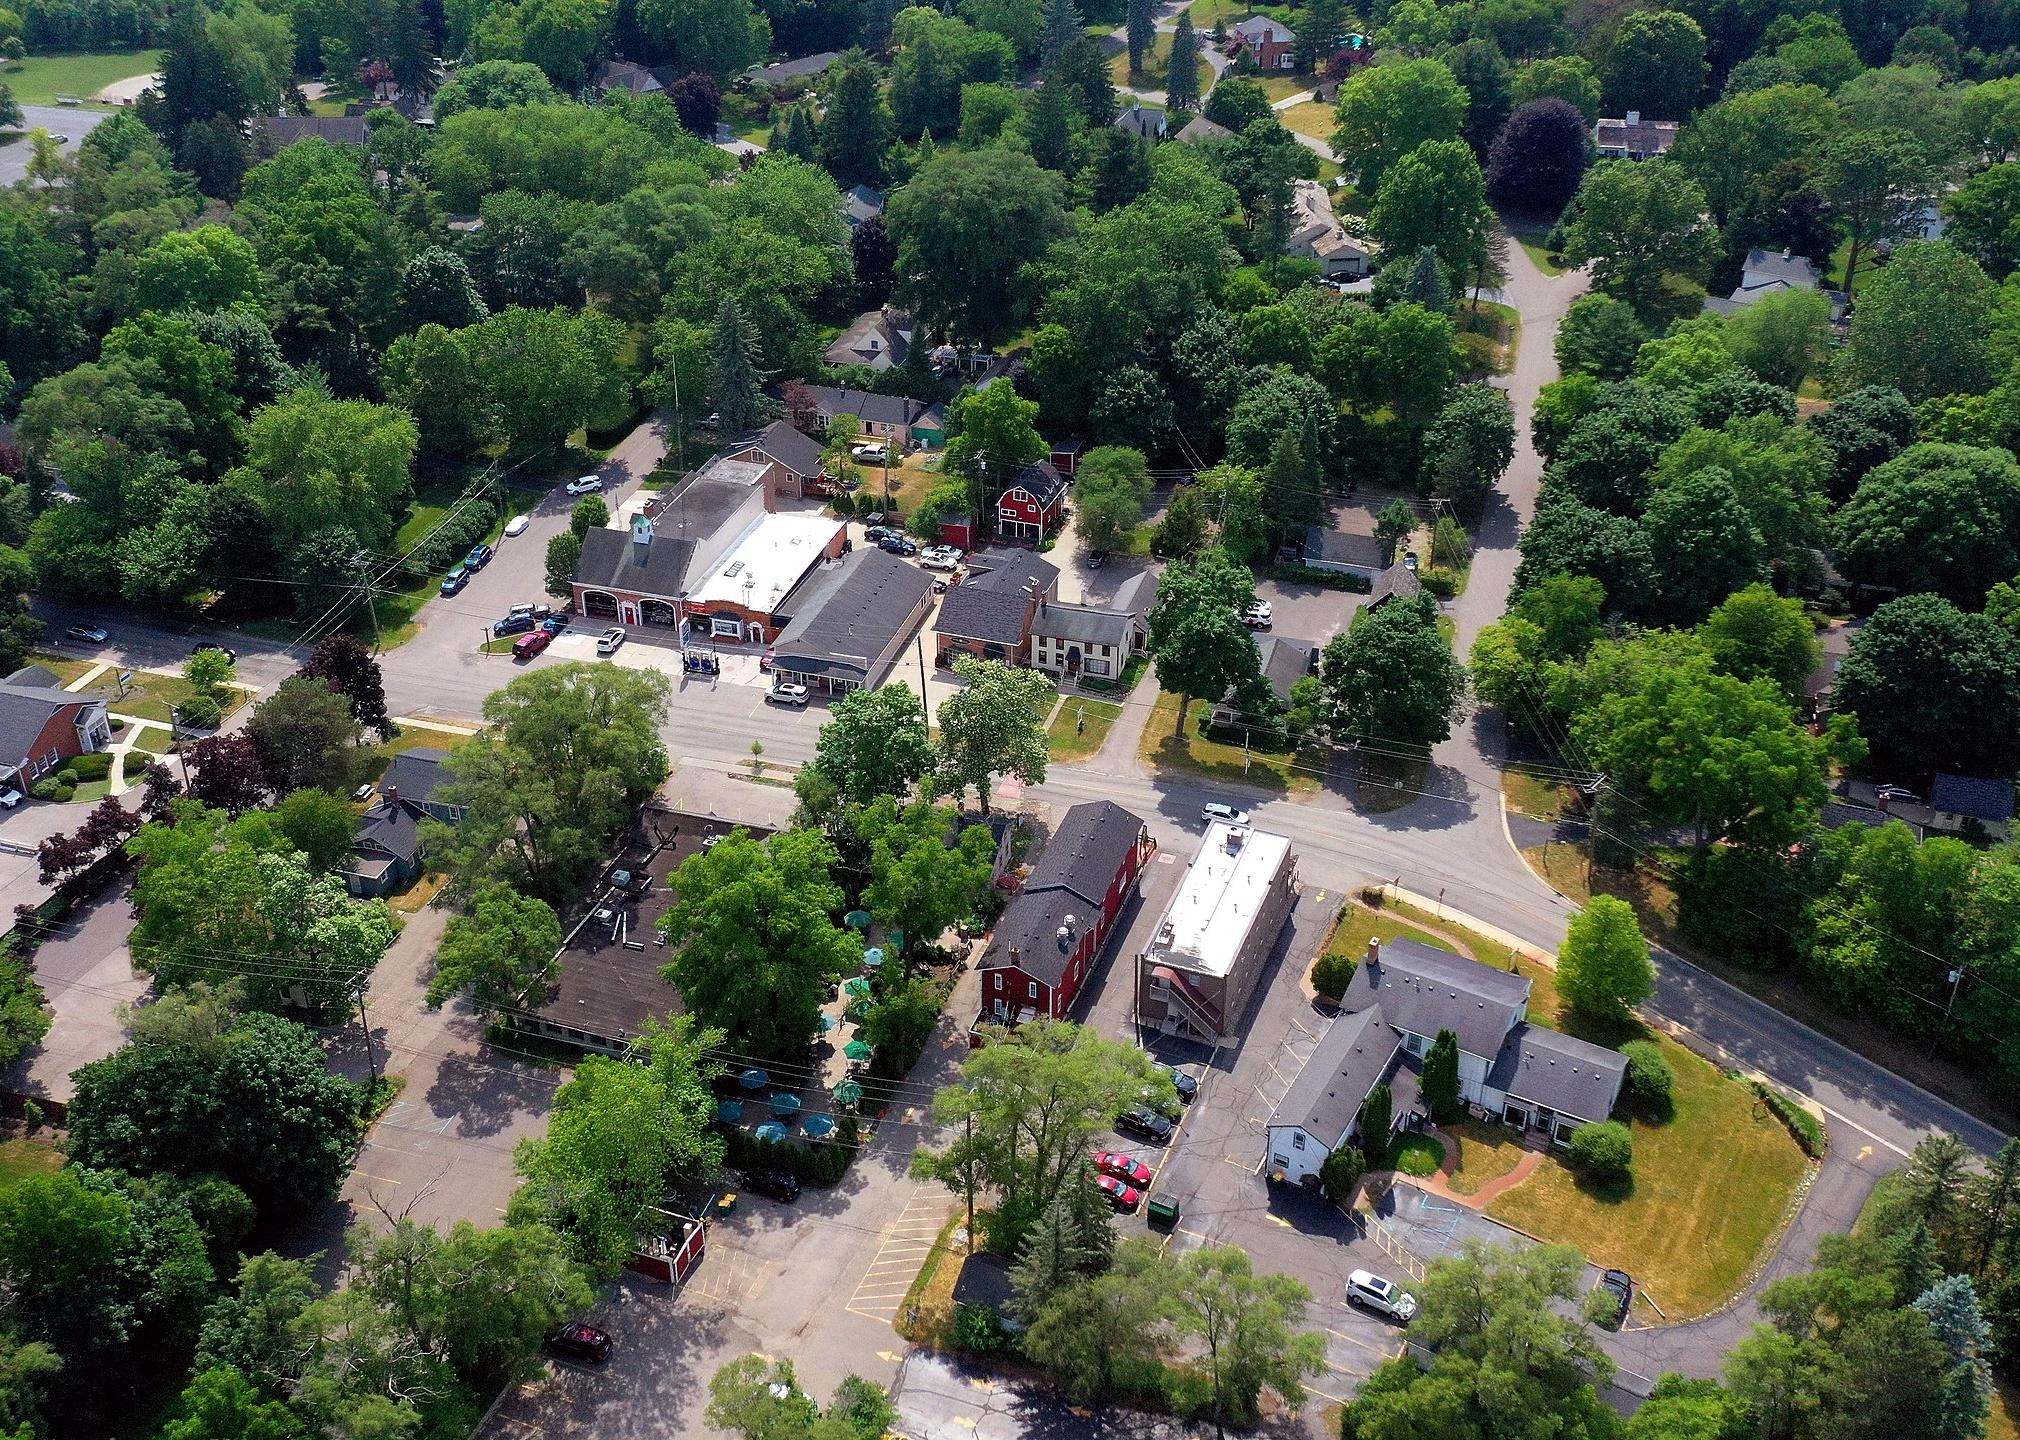
Across the 12 Midwest states are suburban and rural villages with more charm than size, which make for an ideal home. What these towns lack in size, they more than make up for in historical sites, lush woodlands, and friendly locals. Plus, residents can enjoy the accessibility to larger cities nearby without enduring the hustle and bustle of living in them.
To determine which of the Midwest’s small towns are the best places to live, Stacker used data from Niche’s 2022 Best Places to Live and narrowed the results to places in the Midwest with less than 5,000 residents. Niche determined its rankings by assessing factors such as cost of living, quality of public schools, crime and safety, and access to health resources. For each town, Stacker included the population, percentage of homeowners, percentage of renters, and median income.
You may also like: The richest town in every state
![]()

SilentMatt Psychedelic // Wikimedia Commons
#25. Glenwillow, Ohio
– Population: 861
– Median home value: $225,000 (84% own)
– Median rent: $716 (16% rent)
– Median household income: $84,000
Founded in 1893 as a company town by ammunition manufacturer Austin Powder Company, Glenwillow, Ohio, has been revamped. Old manufacturing facilities and housing stock have been replaced with boutiques, restaurants, and a modernized residential district. The quaint village is also part of the Solon School District, consistently rated as one of the best school systems in the state.
Lrgjr72 // Wikimedia Commons
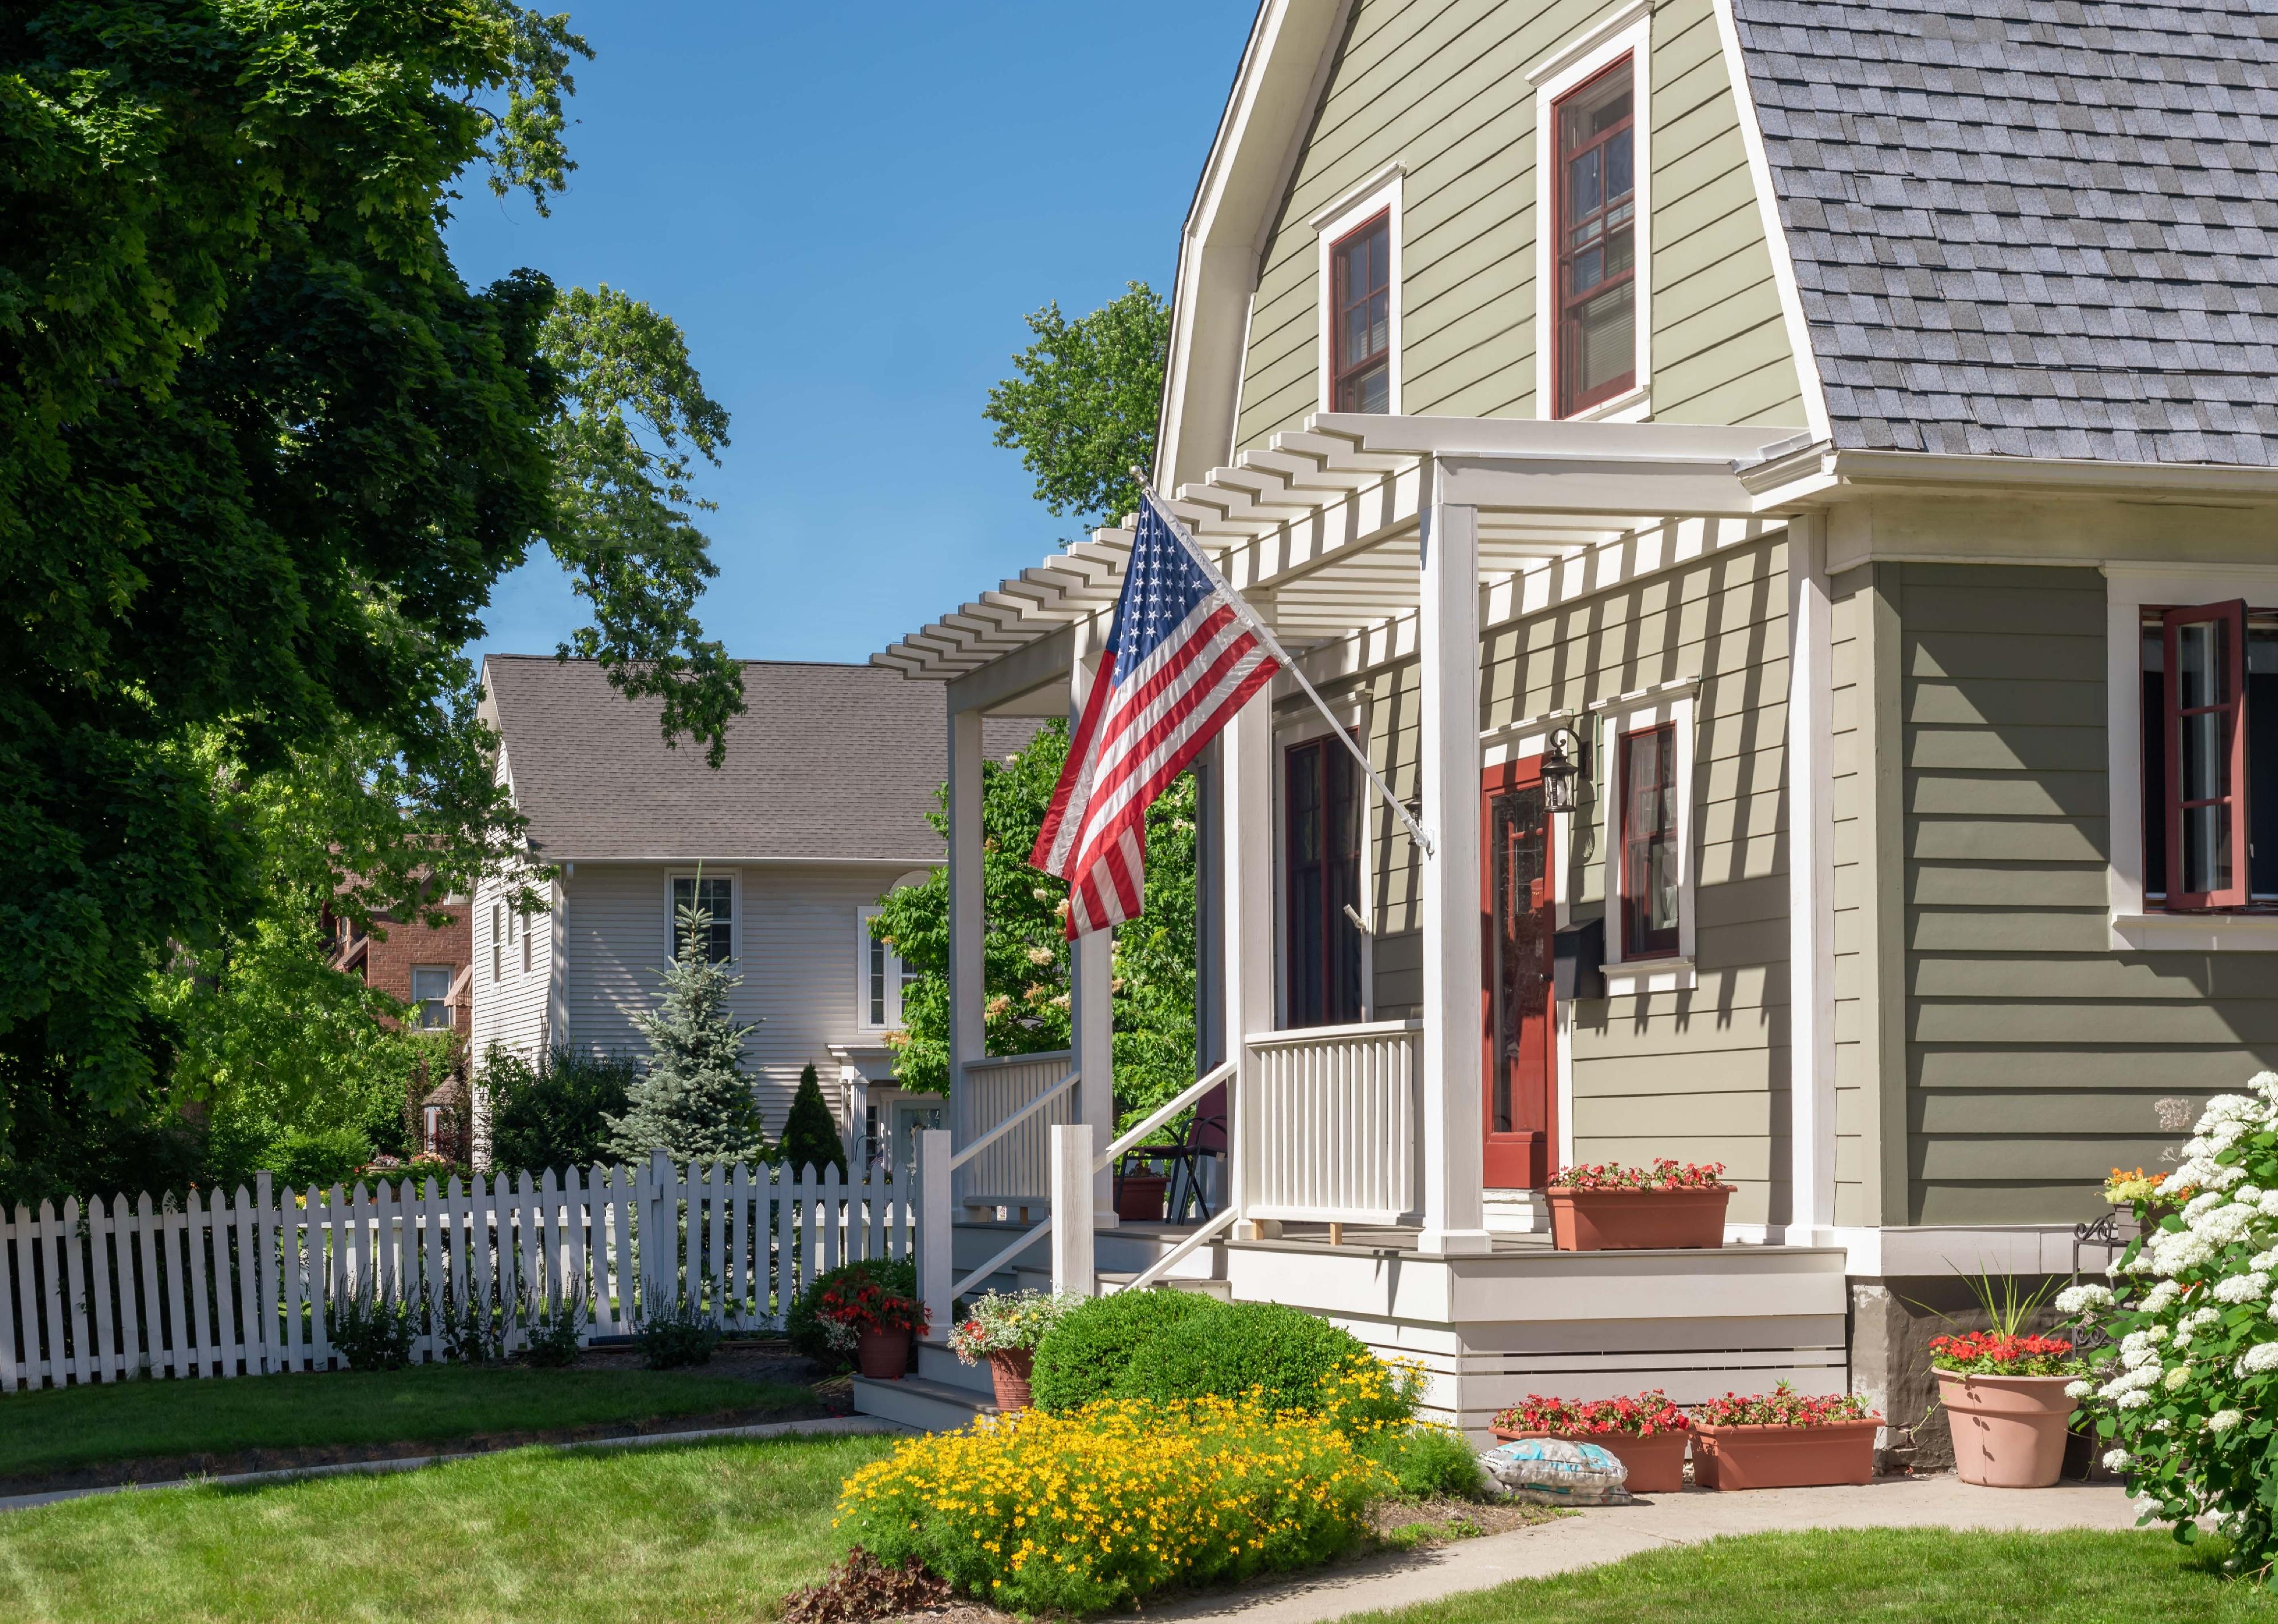
#24. Franklin, Michigan
– Population: 2,790
– Median home value: $612,900 (93% own)
– Median rent: $3,354 (7% rent)
– Median household income: $155,703
With an impressive amount of preserved historical architecture dating to the early 19th century, Franklin, Michigan, is home to the state’s first designated historic district and is listed on the National Register of Historic Places. The town, just 20 minutes from Detroit, is renowned for its large homes.

N K // Shutterstock
#23. Tower Lakes, Illinois
– Population: 1,340
– Median home value: $465,800 (97% own)
– Median rent: $2,350 (3% rent)
– Median household income: $148,750
This small town is much more than just a Chicago suburb, although its proximity to the Windy City is part of its appeal. Tower Lakes, Illinois, is built around two lakes and prides itself on preserving the health and beauty of its environment. Residents regularly participate in reforestation and clean-up efforts; the town has been designated as a “tree city” by the Arbor Day Foundation for more than 25 years.

Jim Packett // Shutterstock
#22. Bayside, Wisconsin
– Population: 4,579
– Median home value: $349,000 (79% own)
– Median rent: $1,411 (21% rent)
– Median household income: $114,814
Bayside, Wisconsin, is a village in Milwaukee that is home to an environmentally minded community—with 15% of the town’s total acreage devoted to nature conservation. It’s home to the Schlitz Audubon Nature Center, with six miles of trails through woods and along Lake Michigan.
Quint2724 // Wikimedia Commons
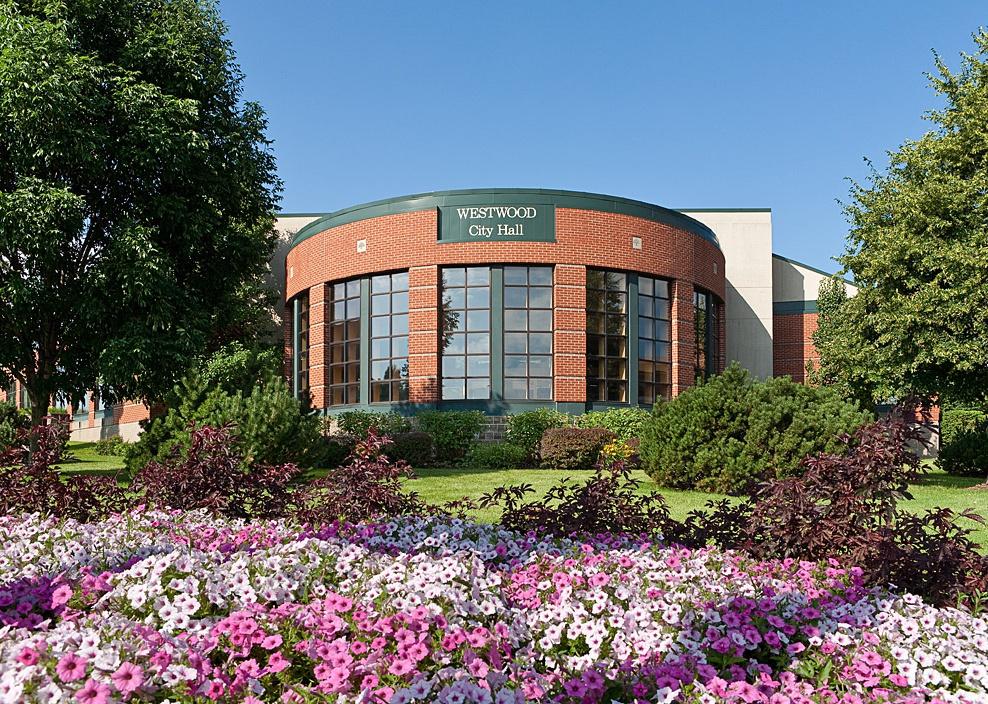
#21. Westwood, Kansas
– Population: 1,834
– Median home value: $315,400 (81% own)
– Median rent: $1,520 (19% rent)
– Median household income: $77,750
Westwood is a town in northeastern Kansas that features large parks, cycling trails, and a variety of shops and restaurants. It is also home to several University of Kansas hospital facilities, including the University of Kansas Cancer Center.

David Papazian // Shutterstock
#20. Meridian Hills, Indiana
– Population: 1,736
– Median home value: $554,900 (100% own)
– Median rent: $2,667 (0% rent)
– Median household income: $172,969
Located just six miles from Indianapolis, Meridian Hills, Indiana, is best known for its high-end residential community. Established in 1937, the 1.5-square-mile town is characterized by rolling hills, rippling streams, and trails for hiking.

Ursula Page // Shutterstock
#19. Fairway, Kansas
– Population: 4,147
– Median home value: $459,600 (91% own)
– Median rent: $1,642 (9% rent)
– Median household income: $136,579
Located close to several golf courses, this small town lives up to the inspiration behind its name with its expansive green lawns. Fairway, Kansas, is also rich in historical sites, including one National Historic Landmark—the Shawnee Indian Mission State Historic Site.
David Prahl // Shutterstock
#18. River Hills, Wisconsin
– Population: 1,496
– Median home value: $637,900 (97% own)
– Median rent: $99 (3% rent)
– Median household income: $178,750
River Hills, Wisconsin, has a rich history as a summer and vacation home destination for wealthy Midwesterners. The local country club held fox hunts and polo matches well into the 1960s. The town housed a Nike anti-aircraft missile site during the Cold War. Today, the community is the only one in Milwaukee County that is zoned 100% residential, with exceptions for a country club, houses of worship, a school, and a sculpture garden.

Stephanie Frey // Shutterstock
#17. Moreland Hills, Ohio
– Population: 3,436
– Median home value: $463,000 (94% own)
– Median rent: $1,723 (6% rent)
– Median household income: $182,100
Located just 14 miles from Cleveland, Moreland Hills, Ohio, is an affluent suburb that prides itself on its history. The town is the birthplace of 20th president James A. Garfield. He is commemorated with four key sites along the Garfield Trail of Ohio, including a replica of the log cabin where Garfield was born.

Monkey Business Images // Shutterstock
#16. Orange, Ohio
– Population: 3,410
– Median home value: $373,600 (92% own)
– Median rent: $2,262 (8% rent)
– Median household income: $133,681
Orange, Ohio, is a Cleveland suburb with more than 60 acres of park space, including a golf course, hiking trails, and community garden. The town center frequently hosts festivals and celebrations for the close-knit community.

WNstock // Shutterstock
#15. Kildeer, Illinois
– Population: 4,093
– Median home value: $639,900 (99% own)
– Median rent: $961 (1% rent)
– Median household income: $226,375
Kildeer, Illinois, is a Chicago suburb consisting of several upscale residential areas and four shopping centers. Its founders limited housing development exclusively to custom houses on large lots. The town is home to Kemper Lakes, a prestigious golf club that has hosted many major golf championships, including the PGA Championship.

dezy // Shutterstock
#14. Leland Grove, Illinois
– Population: 1,336
– Median home value: $235,100 (95% own)
– Median rent: $1,059 (5% rent)
– Median household income: $123,810
Founded in 1950, Leland Grove offers residents plenty of trails and parks for a breath of fresh air in addition to a variety of restaurants and shops. The Springfield, Illinois, suburb covers 400 acres of grasslands and is known for its lush greenery.

On The Run Photo // Shutterstock
#13. Kenilworth, Illinois
– Population: 2,423
– Median home value: $1,286,500 (95% own)
– Median rent: $3,501 (5% rent)
– Median household income: $250,001
Kenilworth, Illinois, founded in 1889, is a Chicago suburb bordering Lake Michigan. The town is home to some impressive architecture thanks to the city’s former architect and town planner George W. Maher, a colleague of Frank Lloyd Wright. Wright’s own structure, a Prairie School-style home named the Hiram Baldwin House, is also located in the village.

Lori Butcher // Shutterstock
#12. Riverwoods, Illinois
– Population: 3,742
– Median home value: $705,700 (95% own)
– Median rent: $3,238 (5% rent)
– Median household income: $213,068
Riverwoods, Illinois, is a village on the banks of the Des Plaines River located within flourishing, expansive woodlands. The town prides itself on its scenery and actively involves community members in protecting the surrounding environment.

BublikHaus // Shutterstock
#11. Warson Woods, Missouri
– Population: 2,229
– Median home value: $470,500 (98% own)
– Median rent: $1,450 (2% rent)
– Median household income: $173,333
Warson Woods, Missouri, is a town just west of St. Louis and offers residents an abundance of services, including a pool, pavilion for parties, and food truck nights in the summer.

ET Tisomboon // Shutterstock
#10. Lauderdale, Minnesota
– Population: 2,479
– Median home value: $235,500 (50% own)
– Median rent: $1,220 (50% rent)
– Median household income: $68,313
Lauderdale, Minnesota, five miles from Minneapolis, offers residents a mix of urban and suburban living with its combination of shopping districts and residential neighborhoods. The town was named after businessman William Henry Lauderdale, who purchased and donated the land that became the site of the town’s first school and park.
JonHarder // Wikimedia Commons
#9. Hesston, Kansas
– Population: 3,823
– Median home value: $147,300 (55% own)
– Median rent: $658 (45% rent)
– Median household income: $57,370
Hesston, Kansas, is a tightly knit community located 30 miles from Wichita. The town regularly involves residents in cleanup and other initiatives to preserve its scenic environment, which includes expansive fields, parks, and a golf course. The town is also home to two large farm equipment manufacturing plants.

Greg Hume // Wikimedia Commons
#8. Mariemont, Ohio
– Population: 3,497
– Median home value: $407,800 (70% own)
– Median rent: $1,192 (30% rent)
– Median household income: $120,281
Much of Mariemont, Ohio, is built in classic English architectural styles, ranging from the Norman to the Georgian. The village square is designed in Tudor style, and the town is one of the few in America to still have a town crier. Its dedication to preserving bygone eras has earned the town a spot on the National Register of Historic Places.
David Papazian // Shutterstock
#7. Oakland, Missouri
– Population: 1,473
– Median home value: $343,400 (79% own)
– Median rent: $1,234 (21% rent)
– Median household income: $106,597
Oakland, Missouri, may have a total area of just 0.61 square miles, but it wastes no space—the town contains three city parks and plenty of shops and restaurants. The community prides itself on the variety of architecture found within the city limits, which includes everything from arts-and-crafts-style cottages to modern homes.

Appz Dreamer // Shutterstock
#6. Rock Hill, Missouri
– Population: 4,728
– Median home value: $212,000 (84% own)
– Median rent: $1,122 (16% rent)
– Median household income: $78,529
Rock Hill, Missouri, is a suburb of St. Louis. It is a lovely mix of commercial and residential properties. The 1841 Greek Revival Fairfax House is listed on the National Register of Historic Places.
Kamil Zelezik // Shutterstock
#5. Bannockburn, Illinois
– Population: 1,315
– Median home value: $987,500 (84% own)
– Median rent: $1,075 (16% rent)
– Median household income: $147,500
Bannockburn, Illinois, was developed by a Scottish real estate developer who planned a number of country estates for residents to live on in the early 20th century. The town was originally planned to be purely residential, but today has a mix of business and residential buildings, affording residents a peaceful place to live while also giving them easy access to goods and services.

Kristi Blokhin // Shutterstock
#4. Sixteen Mile Stand, Ohio
– Population: 3,589
– Median home value: $479,800 (56% own)
– Median rent: $1,384 (44% rent)
– Median household income: $109,142
Sixteen Mile Stand, Ohio, was originally a stagecoach stop 16 miles from Cincinnati. Today, an extensive park system offers residents plenty of green space, and lots of local sports opportunities. Trails built around the city also allow hikers to get moving any time they like.

Asher Heimermann // Wikimedia Commons
#3. Kohler, Wisconsin
– Population: 2,072
– Median home value: $284,000 (91% own)
– Median rent: $1,208 (9% rent)
– Median household income: $111,563
Kohler, Wisconsin, was founded in the early 20th century as a company town for the Kohler Company, best known for its plumbing equipment. Kohler is still the largest employer in the town and abides by the standards set by its founder to create and maintain a hybrid garden-industrial town with charm and character.

LittleT889 // Wikimedia Commons
#2. Frontenac, Missouri
– Population: 3,614
– Median home value: $757,700 (98% own)
– Median rent: $1,707 (2% rent)
– Median household income: $200,625
Frontenac, Missouri, is an elegant town just west of St. Louis. It is mixed commercial and residential, with Plaza Frontenac, a luxurious historic shopping mall, sitting in its center. Numerous homes in the town were built in the mid-19th century.

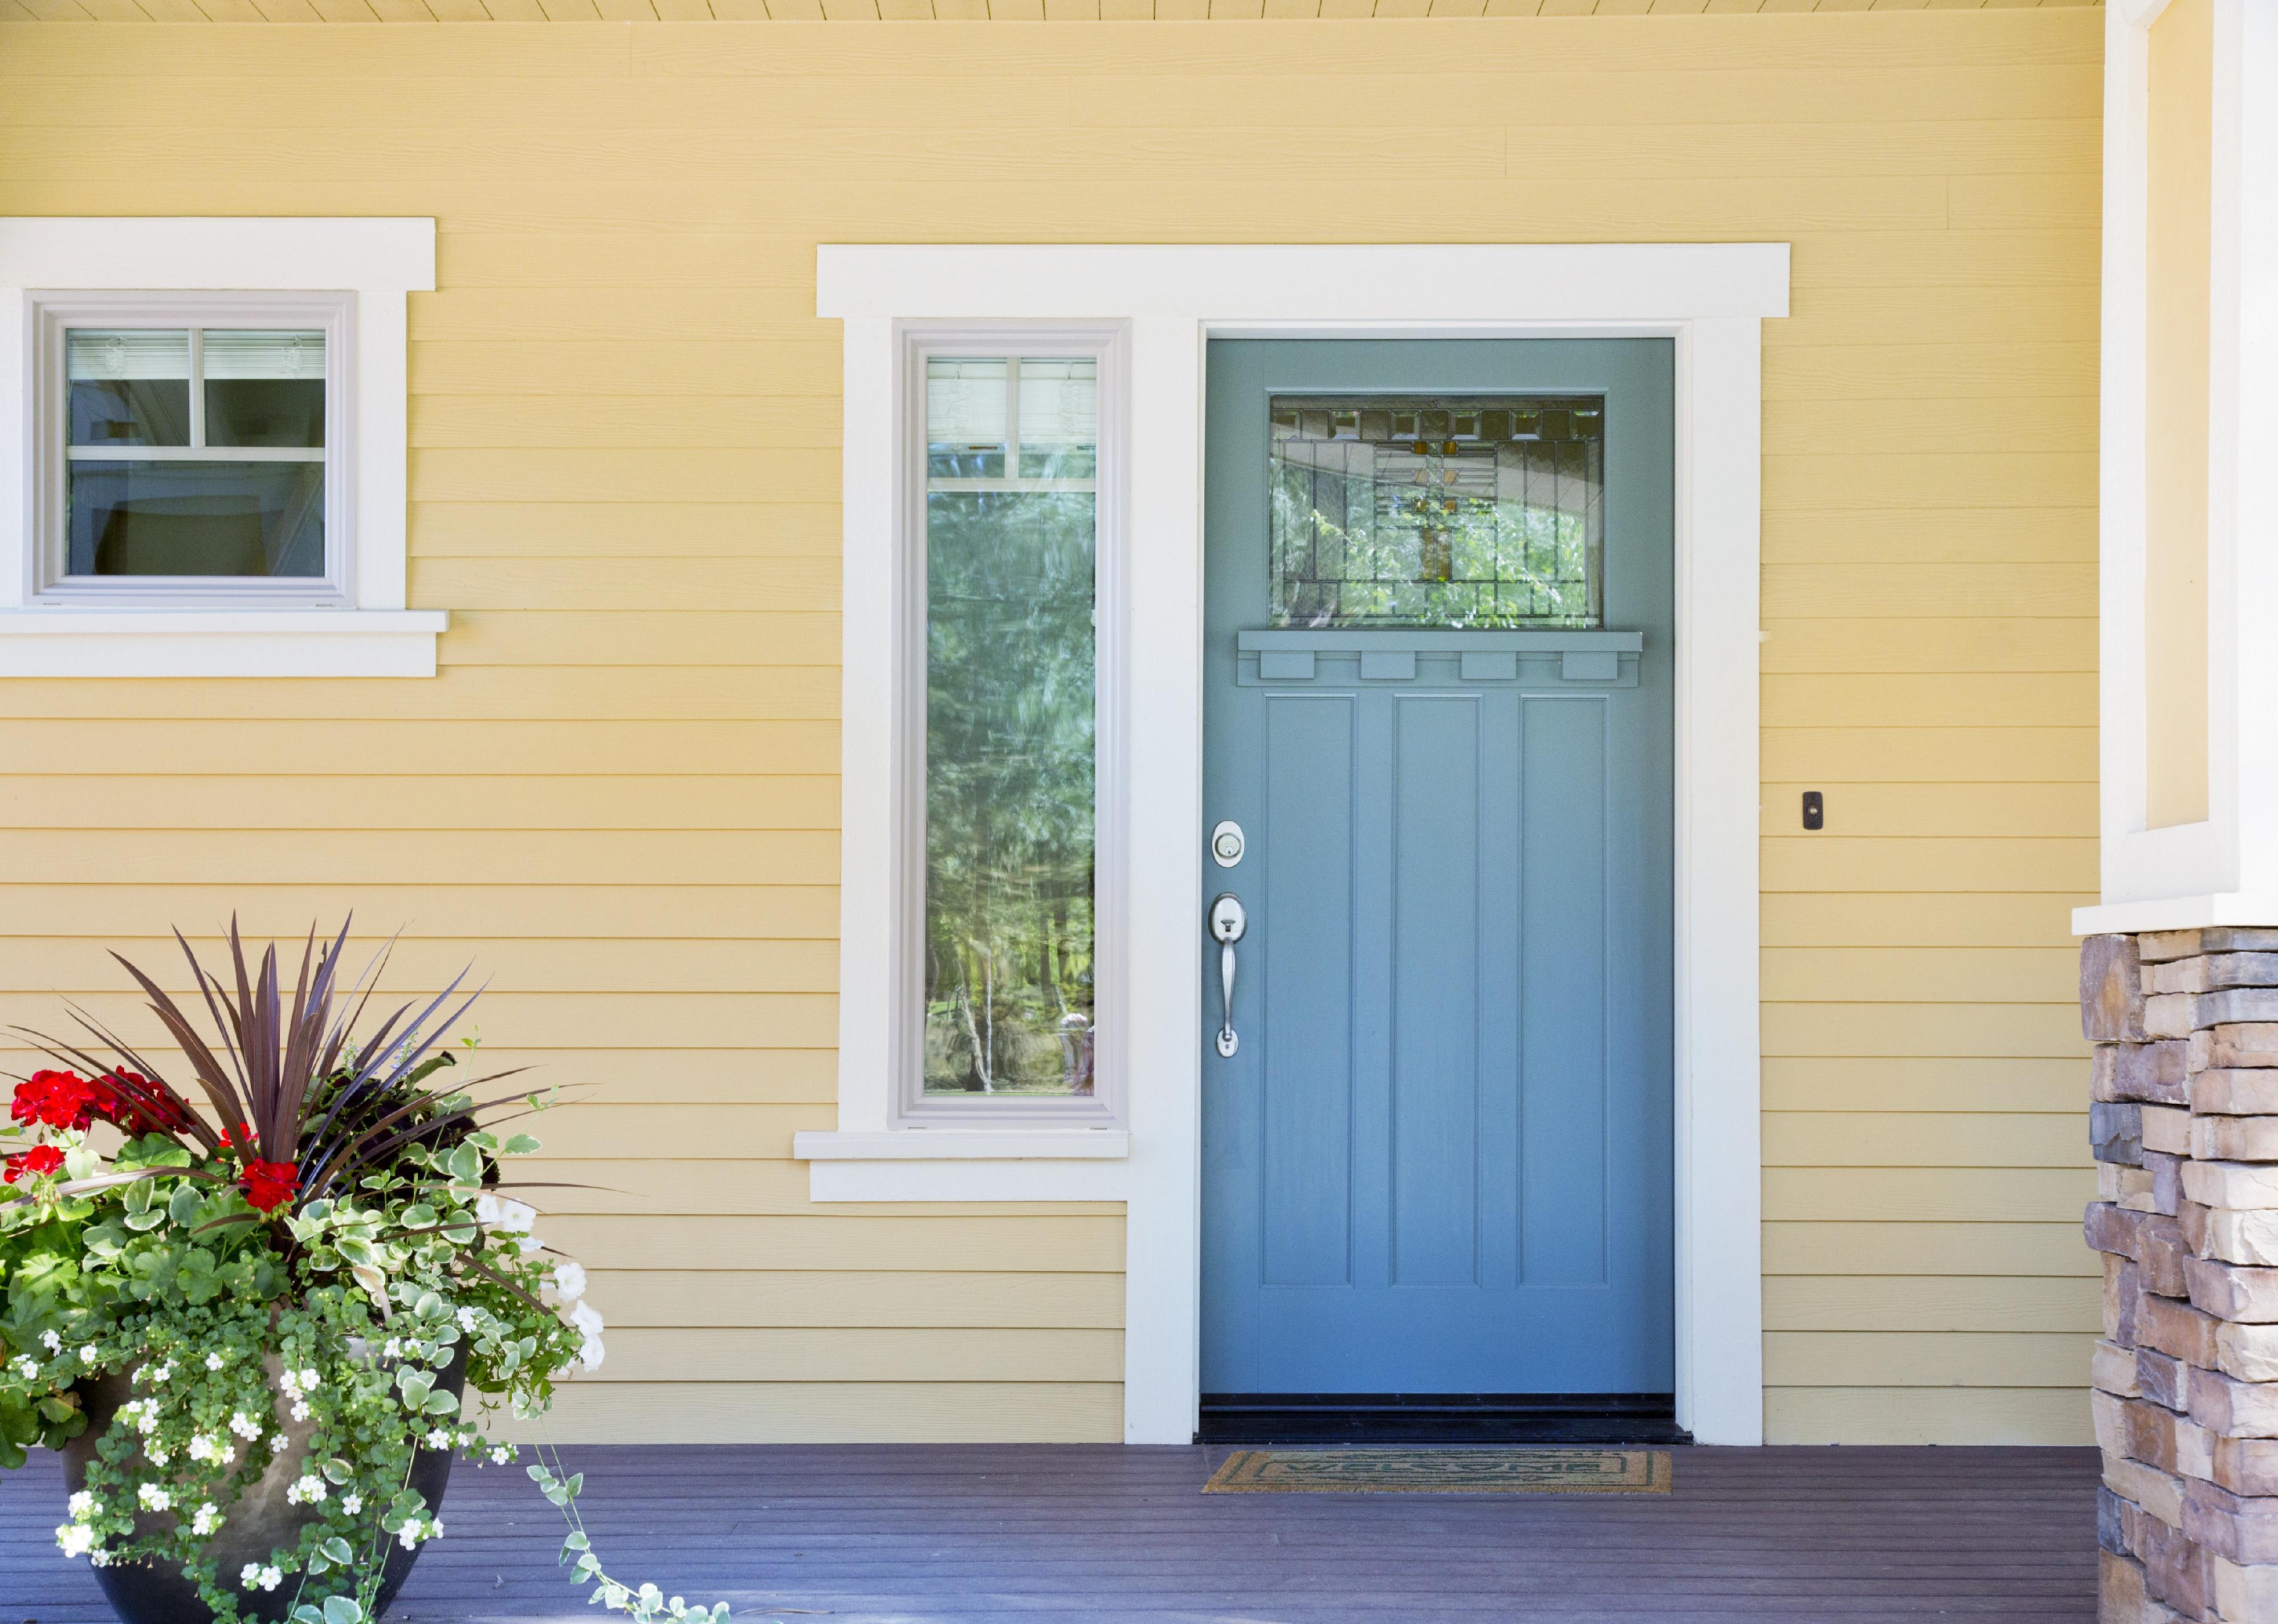
Artazum // Shutterstock
#1. Ottawa Hills, Ohio
– Population: 4,762
– Median home value: $297,700 (86% own)
– Median rent: $1,580 (14% rent)
– Median household income: $165,938
When the hit film “Mr. Blandings Builds His Dream House” premiered in 1948, the studio built a replica house right in Ottawa Hills, Ohio, as a promotion for the movie. The town was the perfect idyllic setting for a replica house, which is now a family home.

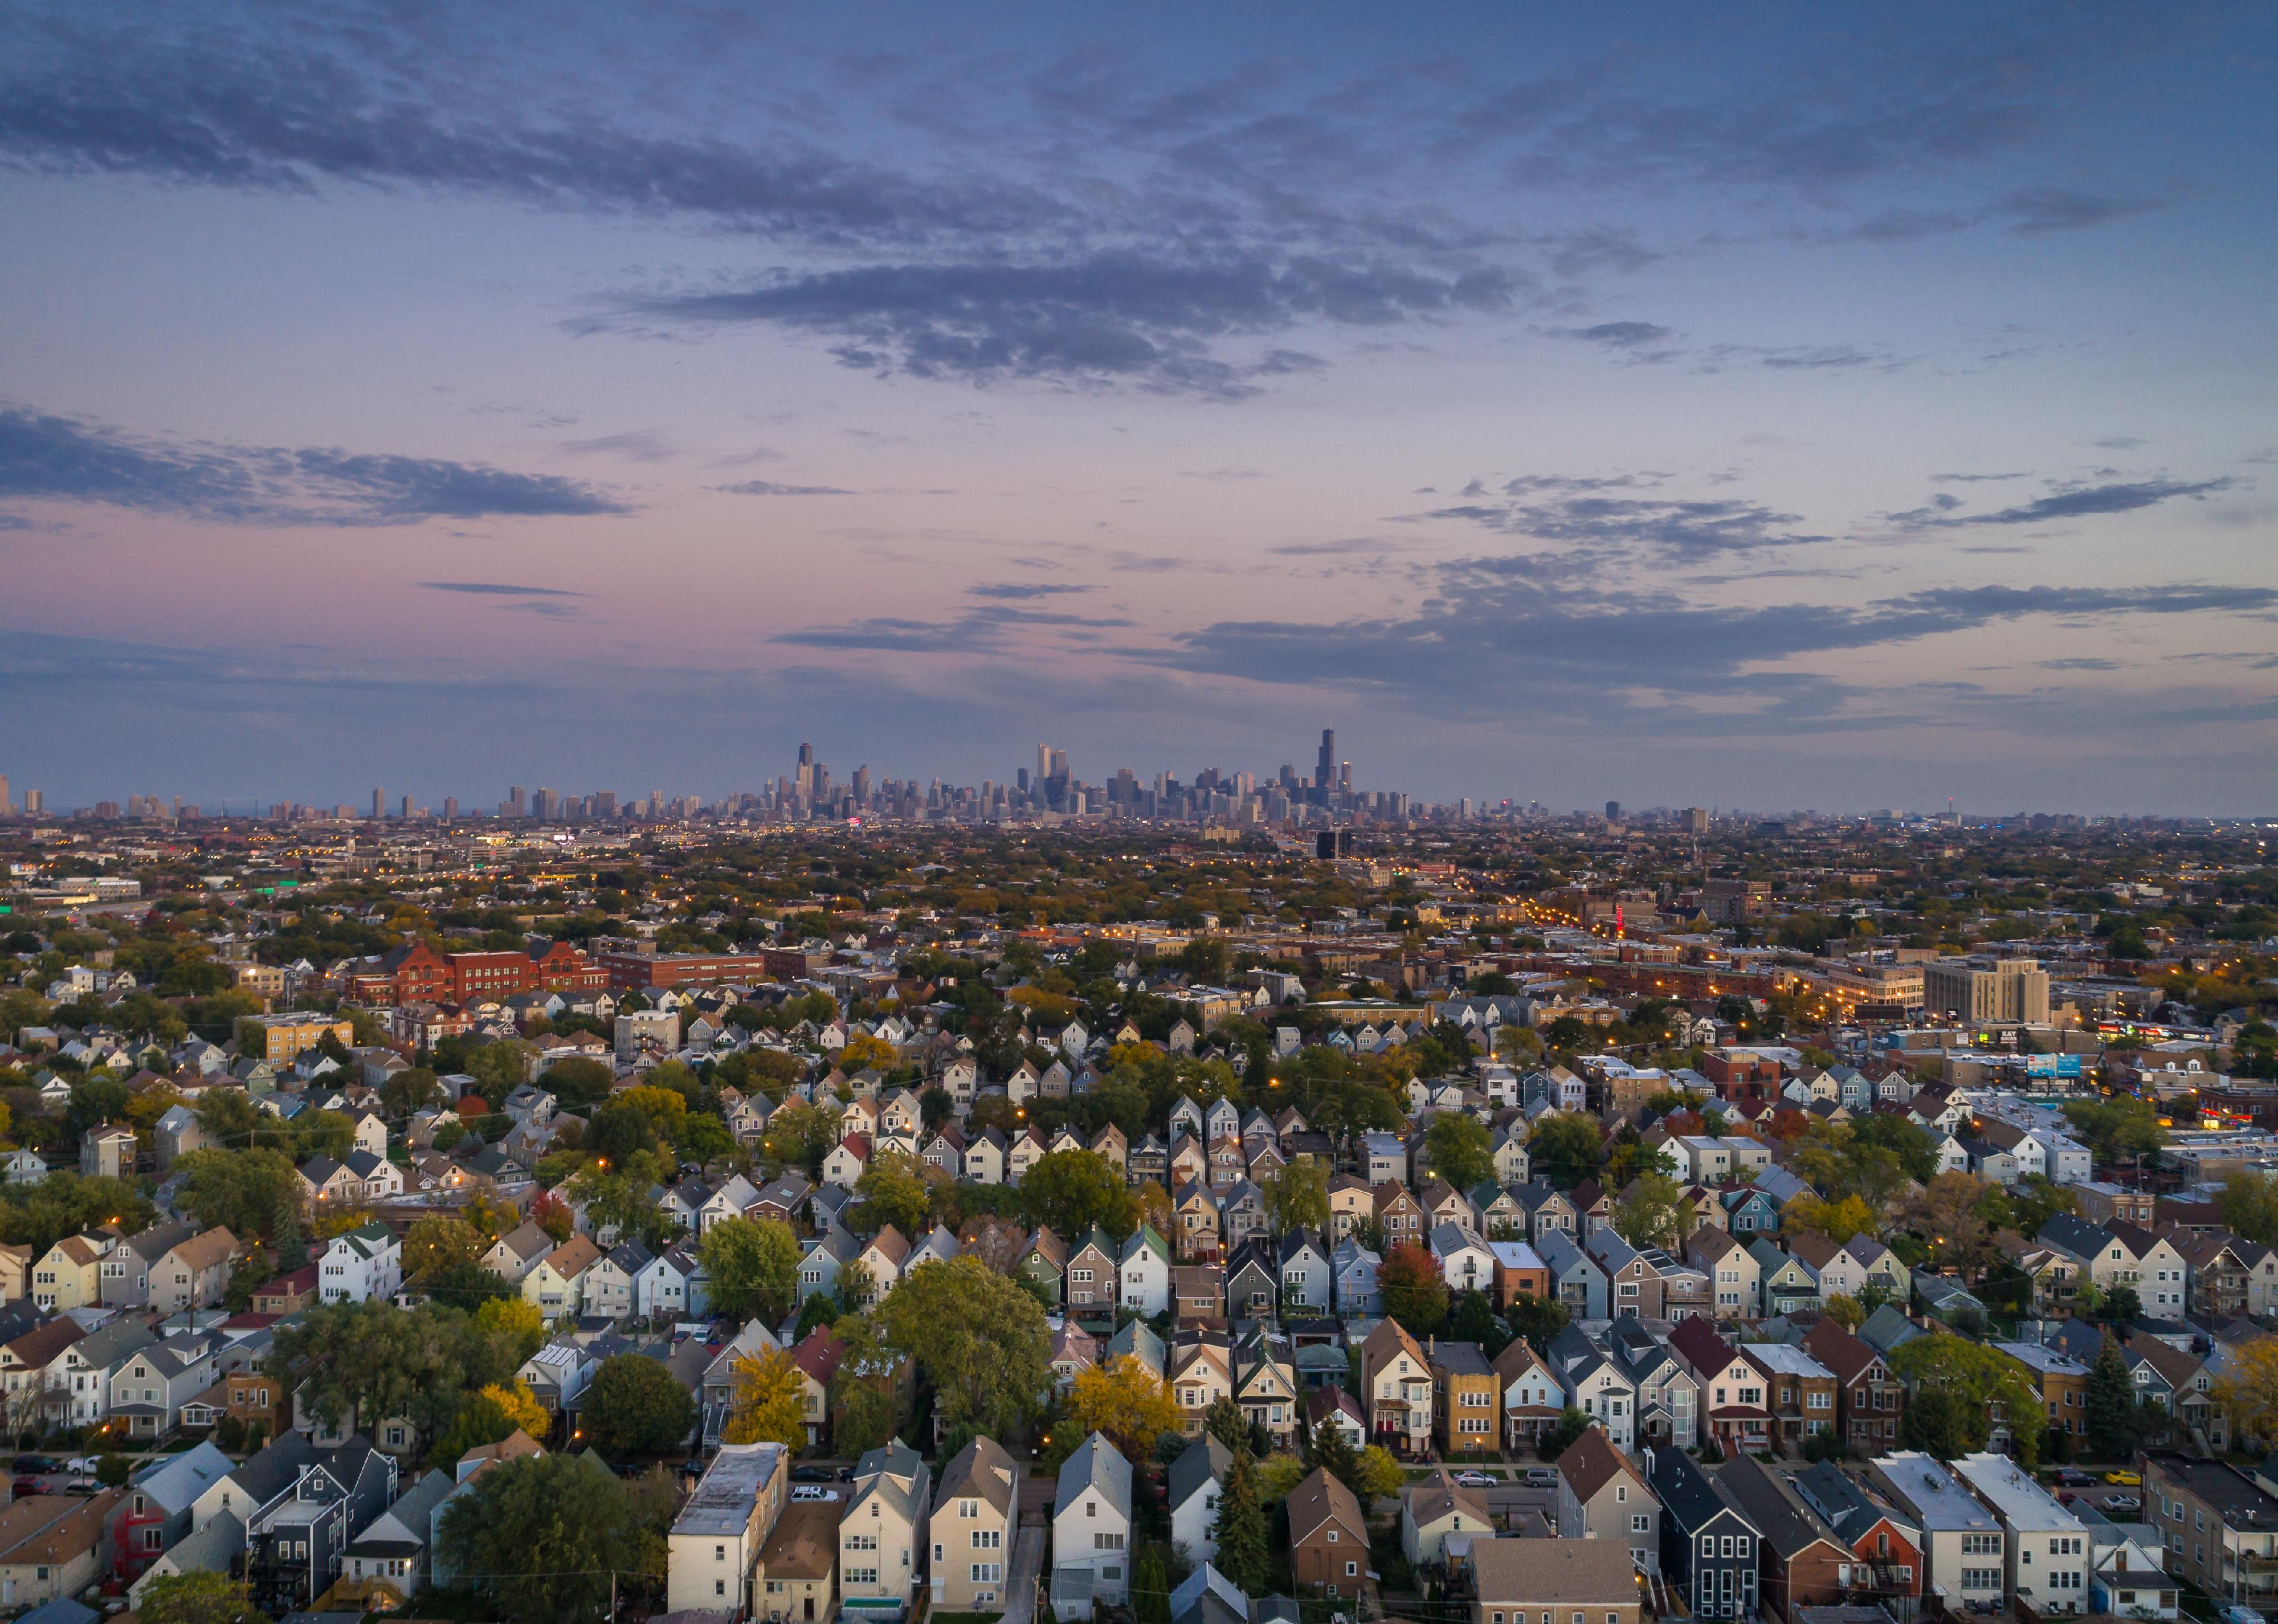
It’s well-documented that the surest, and often best, return on investments comes from playing the long game. But between stocks and real estate, which is the stronger bet?
To find out, financial planning firm Wealth Enhancement Group analyzed data from academic research, Standard and Poor’s, and Nareit to see how real estate compares to stocks as an investment.
Data going back to 1870 shows the well-established power of real estate as a powerful “long-run investment.” From 1870-2015, and after adjusting for inflation, real estate produced an average annual return of 7.05%, compared to 6.89% for equities. These findings, published in the 2019 issue of The Quarterly Journal of Economics, illustrate that stocks can deviate as much as 22% from their average, while housing only spreads out 10%. That’s because despite having comparable returns, stocks are inherently more volatile due to following the whims of the business cycle.
Real estate has inherent benefits, from unlocking cash flow and offering tax breaks to building equity and protecting investors from inflation. Investments here also help to diversify a portfolio, whether via physical properties or a real estate investment trust. Investors can track markets with standard resources that include the S&P CoreLogic Case-Shiller Home Price Indices, which tracks residential real estate prices; the Nareit U.S. Real Estate Index, which gathers data on the real estate investment trust, or REIT, industry; and the S&P 500, which tracks the stocks of 500 of the largest companies in the U.S.
High interest rates and a competitive market dampened the flurry of real-estate investments made in the last four years. The rise in interest rates equates to a bigger borrowing cost for investors, which can spell big reductions in profit margins. That, combined with the risk of high vacancies, difficult tenants, or hidden structural problems, can make real estate investing a less attractive option—especially for first-time investors.
Keep reading to learn more about whether real estate is a good investment today and how it stacks up against the stock market.
![]()
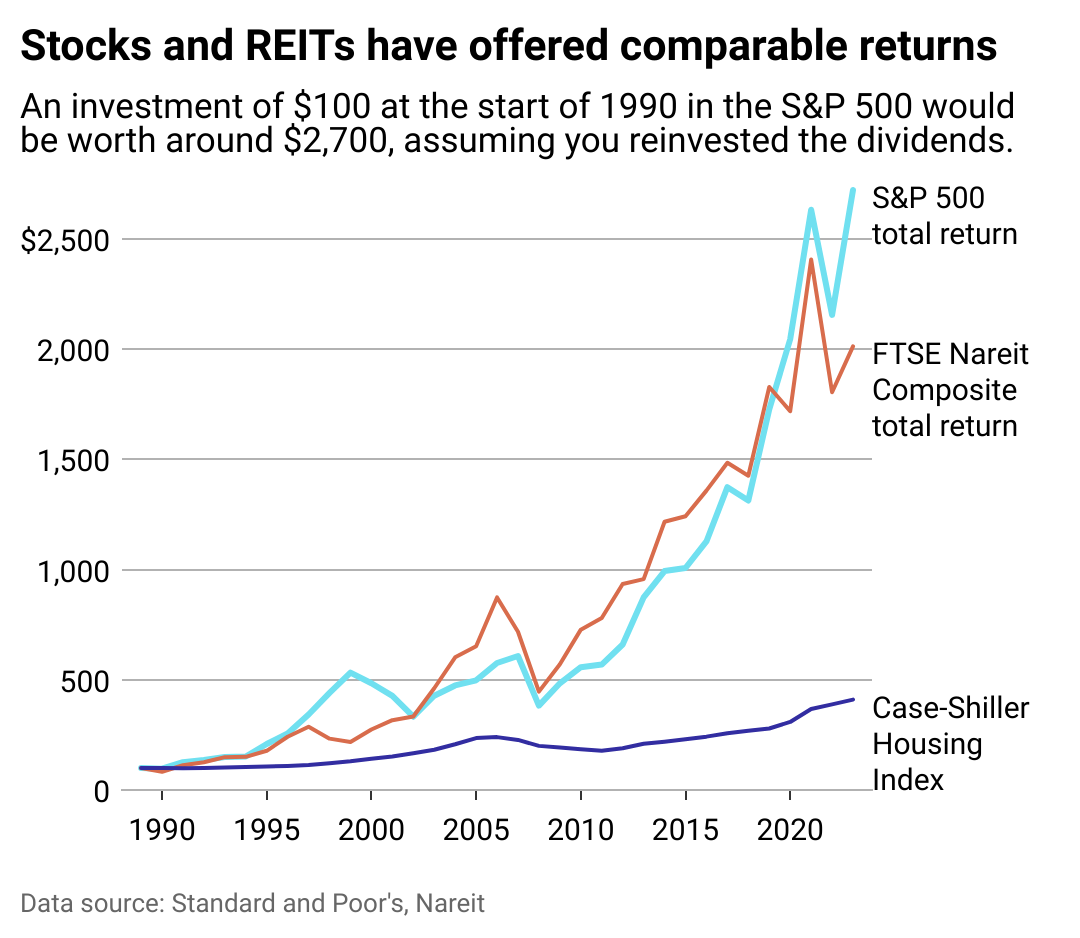
Wealth Enhancement Group
Stocks and housing have both done well
REITs can offer investors the stability of real estate returns without bidding wars or hefty down payments. A hybrid model of stocks and real estate, REITs allow the average person to invest in businesses that finance or own income-generating properties.
REITs delivered slightly better returns than the S&P 500 over the past 20-, 25-, and 50-year blocks. However, in the short term—the last 10 years, for instance—stocks outperformed REITs with a 12% return versus 9.5%, according to data compiled by The Motley Fool investor publication.
Whether a new normal is emerging that stocks will continue to offer higher REITs remains to be seen.
This year, the S&P 500 reached an all-time high, courtesy of investor enthusiasm in speculative tech such as artificial intelligence. However, just seven tech companies, dubbed “The Magnificent 7,” are responsible for an outsized amount of the S&P’s returns last year, creating worry that there may be a tech bubble.
While indexes keep a pulse on investment performance, they don’t always tell the whole story. The Case-Shiller Index only measures housing prices, for example, which leaves out rental income (profit) or maintenance costs (loss) when calculating the return on residential real estate investment.
Wealth Enhancement Group
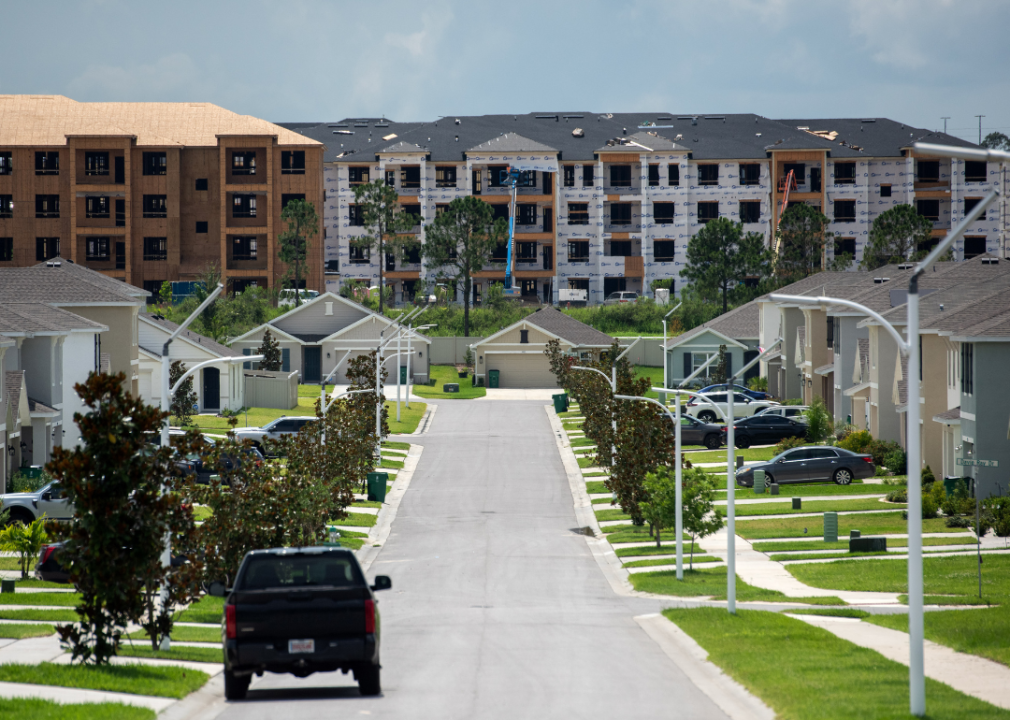
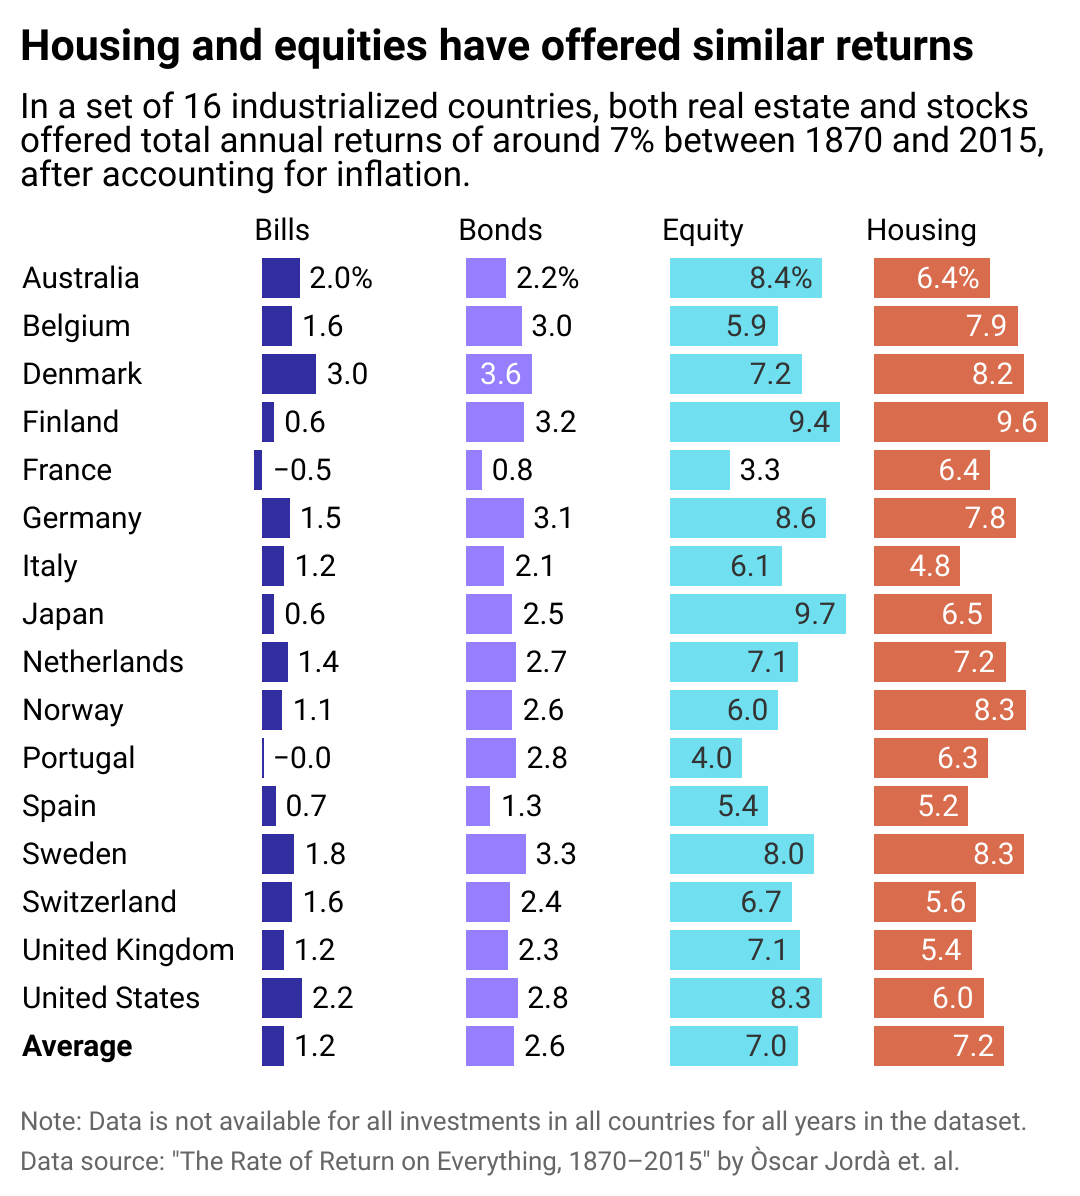
Housing returns have been strong globally too
Like its American peers, the global real estate market in industrialized nations offers comparable returns to the international stock market.
Over the long term, returns on stocks in industrialized nations is 7%, including dividends, and 7.2% in global real estate, including rental income some investors receive from properties. Investing internationally may have more risk for American buyers, who are less likely to know local rules and regulations in foreign countries; however, global markets may offer opportunities for a higher return. For instance, Portugal’s real estate market is booming due to international visitors deciding to move there for a better quality of life. Portugal’s housing offers a 6.3% return in the long term, versus only 4.3% for its stock market.
For those with deep enough pockets to stay in, investing in housing will almost always bear out as long as the buyer has enough equity to manage unforeseen expenses and wait out vacancies or slumps in the market. Real estate promises to appreciate over the long term, offers an opportunity to collect rent for income, and allows investors to leverage borrowed capital to increase additional returns on investment.
Above all, though, the diversification of assets is the surest way to guarantee a strong return on investments. Spreading investments across different assets increases potential returns and mitigates risk.
Story editing by Nicole Caldwell. Copy editing by Paris Close. Photo selection by Lacy Kerrick.
This story originally appeared on Wealth Enhancement Group and was produced and
distributed in partnership with Stacker Studio.

In today’s digital climate, consuming sports has never been easier. Thanks to a plethora of streaming sites, alternative broadcasts, and advancements to home entertainment systems, the average fan has myriad options to watch and learn about their favorite teams at the touch of a button—all without ever having to leave the couch.
As a result, more and more sports venues have committed to improving and modernizing their facilities and fan experiences to compete with at-home audiences. Consider using mobile ticketing and parking passes, self-service kiosks for entry and ordering food, enhanced video boards, and jumbotrons that supply data analytics and high-definition replays. These innovations and upgrades are meant to draw more revenue and attract various sponsored partners. They also deliver unique and convenient in-person experiences that rival and outmatch traditional ways of enjoying games.
In Los Angeles, the Rams and Chargers’ SoFi Stadium has become the gold standard for football venues. It’s an architectural wonder with closer views, enhanced hospitality, and a translucent roof that cools the stadium’s internal temperature.
The Texas Rangers’ ballpark, Globe Life Field, added field-level suites and lounges that resemble the look and feel of a sports bar. Meanwhile, the Los Angeles Clippers are building a new arena (in addition to retail space, team offices, and an outdoor public plaza) that will seat 18,000 people and feature a fan section called The Wall, which will regulate attire and rooting interest.
It’s no longer acceptable to operate with old-school facilities and technology. Just look at Commanders Field (formerly FedExField), home of the Washington Commanders, which has faced criticism for its faulty barriers, leaking ceilings, poor food options, and long lines. Understandably, the team has been attempting to find a new location to build a state-of-the-art stadium and keep up with the demand for high-end amenities.
As more organizations audit their stadiums and arenas and keep up with technological innovations, Uniqode compiled a list of the latest tech advancements to coax—and keep—fans inside venues.
![]()

Jeff Gritchen/MediaNews Group/Orange County Register // Getty Images
Just Walk Out technology
After successfully installing its first cashierless grocery store in 2020, Amazon has continued to put its tracking technology into practice.
In 2023, the Seahawks incorporated Just Walk Out technology at various merchandise stores throughout Lumen Field, allowing fans to purchase items with a swipe and scan of their palms.
The radio-frequency identification system, which involves overhead cameras and computer vision, is a substitute for cashiers and eliminates long lines.
RFID is now found in a handful of stadiums and arenas nationwide. These stores have already curbed checkout wait times, eliminated theft, and freed up workers to assist shoppers, according to Jon Jenkins, vice president of Just Walk Out tech.

Billie Weiss/Boston Red Sox // Getty Images
Self-serve kiosks
In the same vein as Amazon’s self-scanning technology, self-serve kiosks have become a more integrated part of professional stadiums and arenas over the last few years. Some of these function as top-tier vending machines with canned beers and nonalcoholic drinks, shuffling lines quicker with virtual bartenders capable of spinning cocktails and mixed drinks.
The kiosks extend past beverages, as many college and professional venues have started using them to scan printed and digital tickets for more efficient entrance. It’s an effort to cut down lines and limit the more tedious aspects of in-person attendance, and it’s led various competing kiosk brands to provide their specific conveniences.

Kyle Rivas // Getty Images
Mobile ordering
Is there anything worse than navigating the concourse for food and alcohol and subsequently missing a go-ahead home run, clutch double play, or diving catch?
Within the last few years, more stadiums have eliminated those worries thanks to contactless mobile ordering. Fans can select food and drink items online on their phones to be delivered right to their seats. Nearly half of consumers said mobile app ordering would influence them to make more restaurant purchases, according to a 2020 study at PYMNTS. Another study showed a 22% increase in order size.
Many venues, including Yankee Stadium, have taken notice and now offer personalized deliveries in certain sections and established mobile order pick-up zones throughout the ballpark.

Darrian Traynor // Getty Images
QR codes at seats
Need to remember a player’s name? Want to look up an opponent’s statistics at halftime? The team at Digital Seat Media has you covered.
Thus far, the company has added seat tags to more than 50 venues—including two NFL stadiums—with QR codes to promote more engagement with the product on the field. After scanning the code, fans can access augmented reality features, look up rosters and scores, participate in sponsorship integrations, and answer fan polls on the mobile platform.

Boris Streubel/Getty Images for DFL // Getty Images
Real-time data analytics and generative AI
As more venues look to reinvigorate the in-stadium experience, some have started using generative artificial intelligence and real-time data analytics. Though not used widely yet, generative AI tools can create new content—text, imagery, or music—in conjunction with the game, providing updates, instant replays, and location-based dining suggestions
Last year, the Masters golf tournament even began including AI score projections in its mobile app. Real-time data is streamlining various stadium pitfalls, allowing operation managers to monitor staffing issues at busy food spots, adjust parking flows, and alert custodians to dirty or damaged bathrooms. The data also helps with security measures. Open up an app at a venue like the Honda Center in Anaheim, California, and report safety issues or belligerent fans to help better target disruptions and preserve an enjoyable experience.
Story editing by Nicole Caldwell. Copy editing by Paris Close. Photo selection by Lacy Kerrick.
This story originally appeared on Uniqode and was produced and
distributed in partnership with Stacker Studio.

Inflation has cooled substantially, but Americans are still feeling the strain of sky-high prices. Consumers have to spend more on the same products, from the grocery store to the gas pump, than ever before.
Increased import costs are part of the problem. The U.S. is the largest goods importer in the world, bringing in $3.2 trillion in 2022. Import costs rose dramatically in 2021 and 2022 due to shipping constraints, world events, and other supply chain interruptions and cost pressures. At the June 2022 peak, import costs for all commodities were up 18.6% compared to January 2020.
While import costs have since fallen most months—helping to lower inflation—they remain nearly 12% above what they were in 2020. And beginning in 2024, import costs began to rise again, with January seeing the highest one-month increase since March 2022.
Machinery Partner used Bureau of Labor Statistics data to identify the soaring import costs that have translated to higher costs for Americans. Imports in a few industries have had an outsized impact, helping drive some of the overall spikes. Crop production, primary metal manufacturing, petroleum and coal product manufacturing, and oil and gas extraction were the worst offenders, with costs for each industry remaining at least 20% above 2020.
![]()
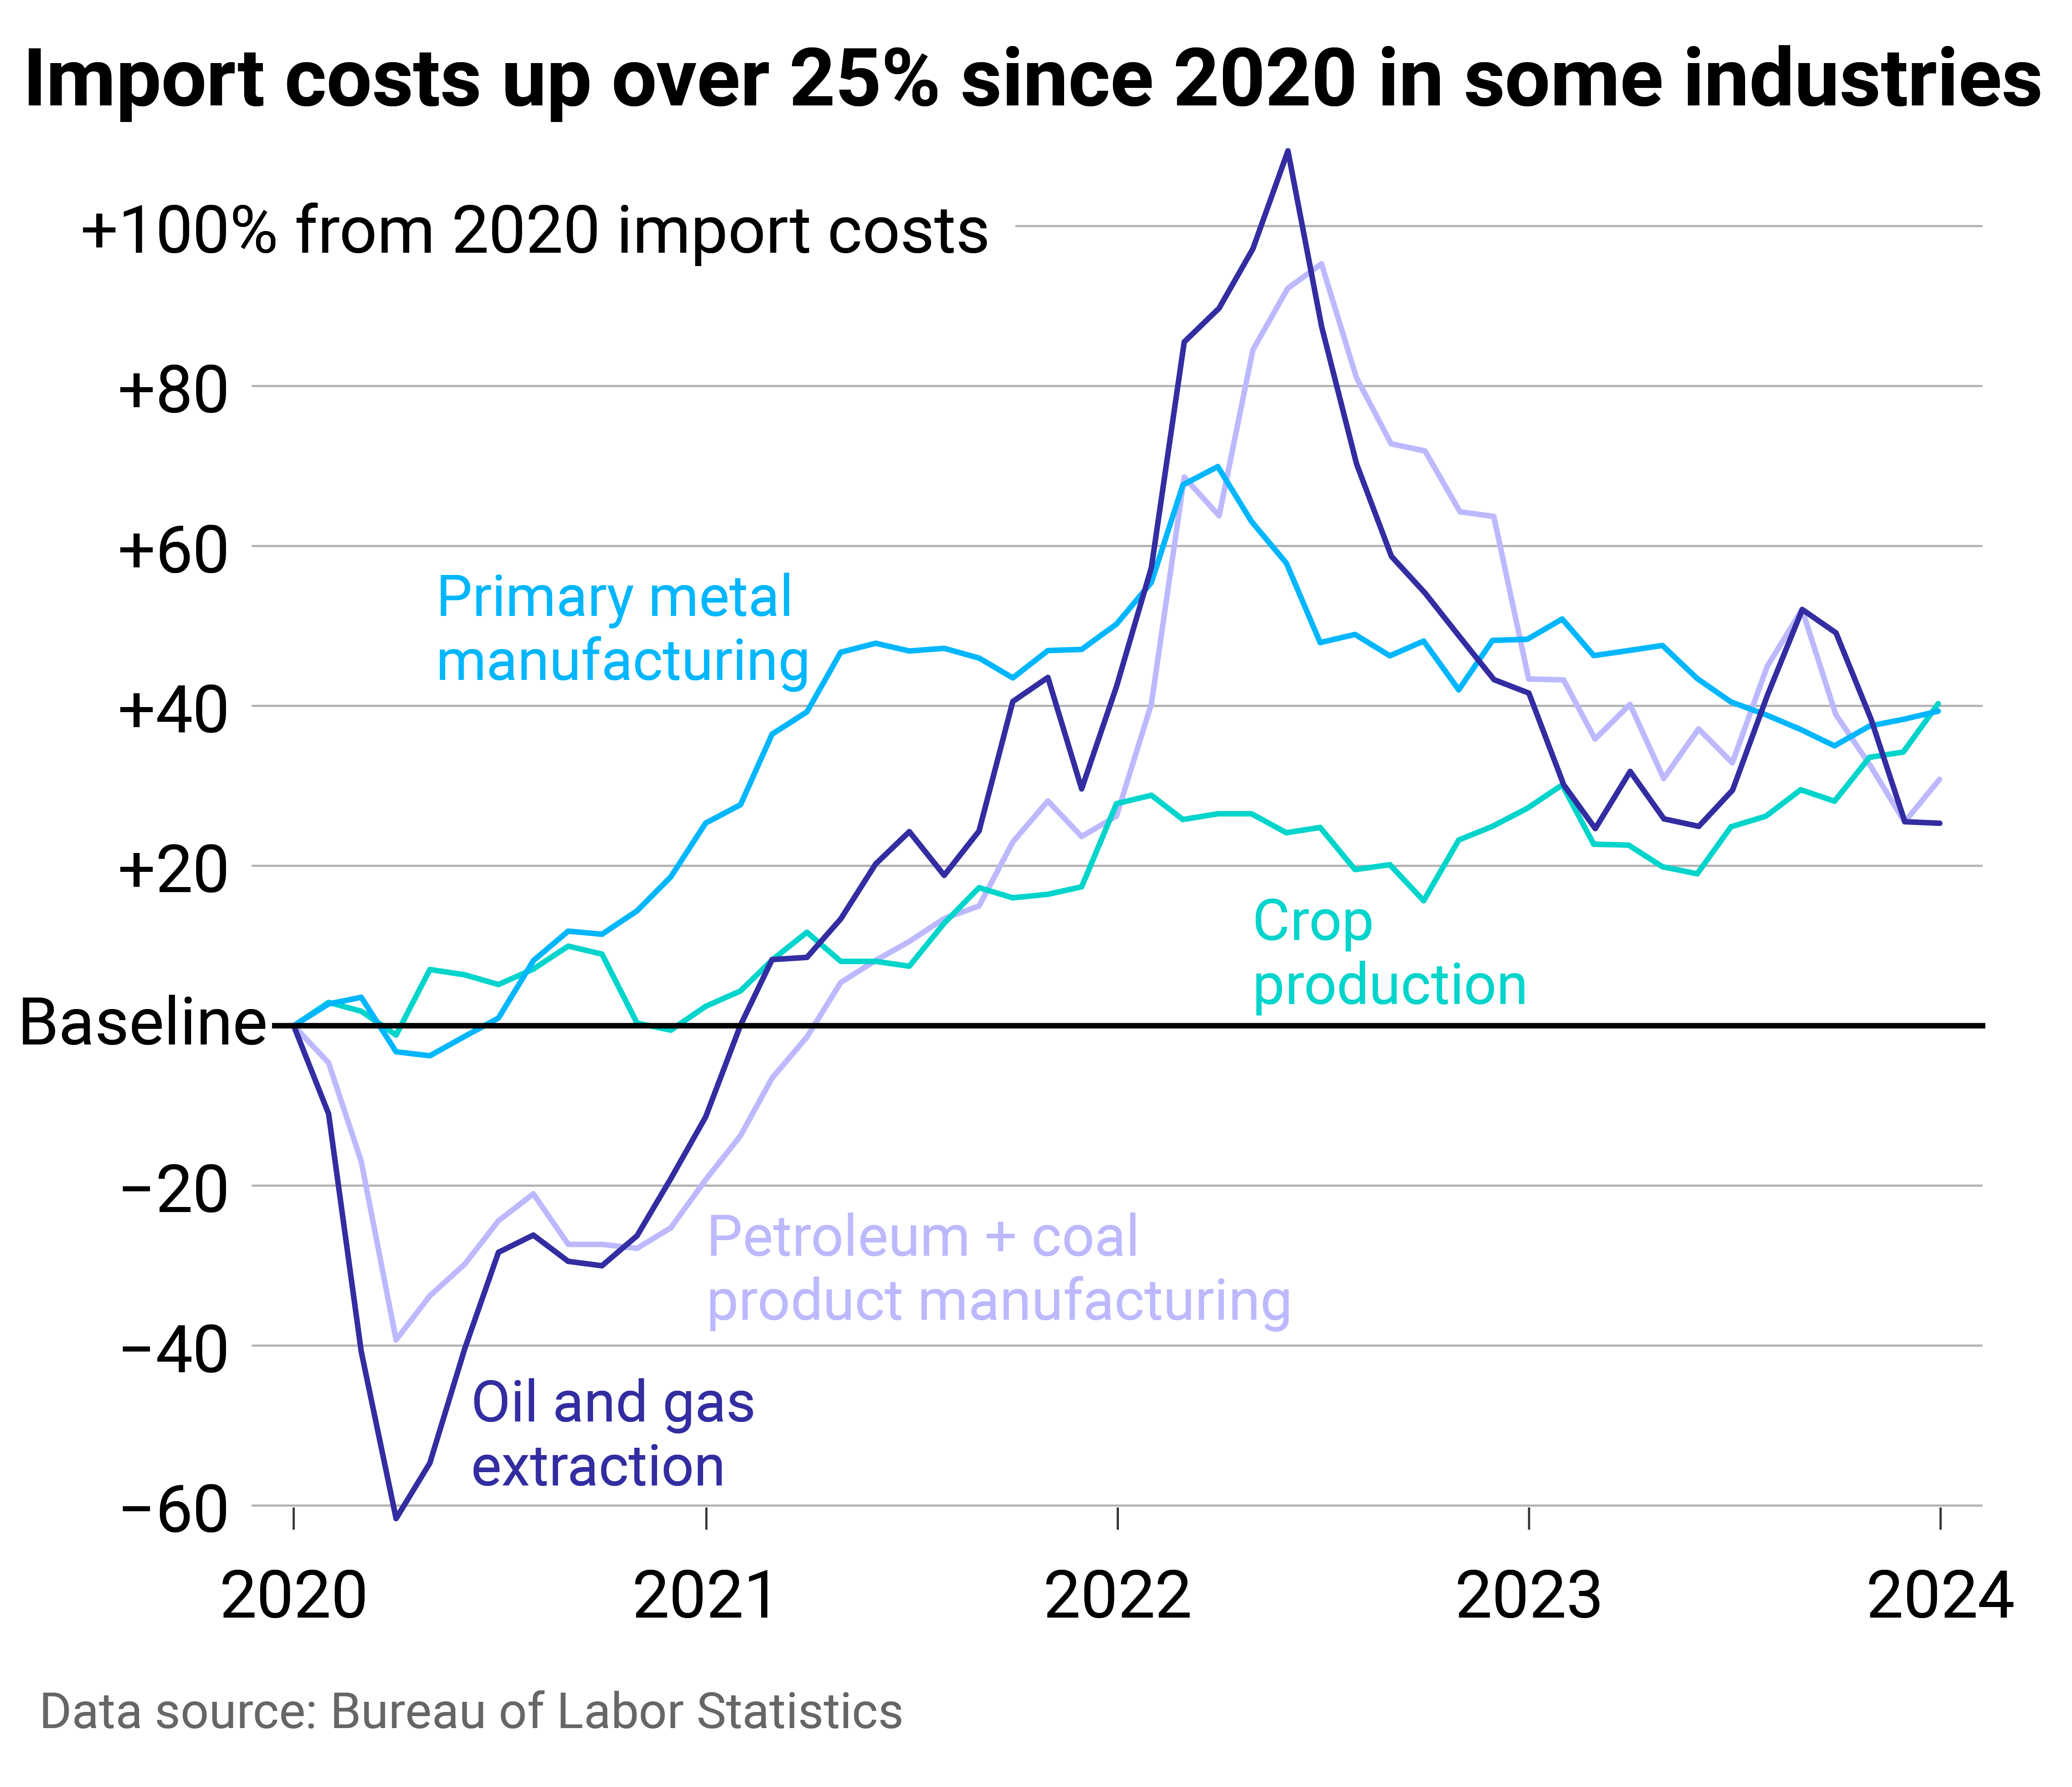
Machinery Partner
Imports related to crops, oil, and metals are keeping costs up
At the mid-2022 peak, import costs related to oil, gas, petroleum, and coal products had the highest increases, doubling their pre-pandemic costs. Oil prices went up globally as leaders anticipated supply disruptions from the conflict in Ukraine. The U.S. and other allied countries put limits on Russian revenues from oil sales through a price cap of oil, gas, and coal from the country, which was enacted in 2022.
This activity around the world’s second-largest oil producer pushed prices up throughout the market and intensified fluctuations in crude oil prices. Previously, the U.S. had imported hundreds of thousands of oil barrels from Russia per day, making the country a leading source of U.S. oil. In turn, the ban affected costs in the U.S. beyond what occurred in the global economy.
Americans felt this at the pump—with gasoline prices surging 60% for consumers year-over-year in June 2022 and remaining elevated to this day—but also throughout the economy, as the entire supply chain has dealt with higher gas, oil, and coal prices.
Some of the pressure from petroleum and oil has shifted to new industries: crop production and primary metal manufacturing. In each of these sectors, import costs in January were up about 40% from 2020.
Primary metal manufacturing experienced record import price growth in 2021, which continued into early 2022. The subsequent monthly and yearly drops have not been substantial enough to bring costs down to pre-COVID levels. Bureau of Labor Statistics reporting shows that increasing alumina and aluminum production prices had the most significant influence on primary metal import prices. Aluminum is widely used in consumer products, from cars and parts to canned beverages, which in turn inflated rapidly.
Aluminum was in short supply in early 2022 after high energy costs—i.e., gas—led to production cuts in Europe, driving aluminum prices to a 13-year high. The U.S. also imposes tariffs on aluminum imports, which were implemented in 2018 to cut down on overcapacity and promote U.S. aluminum production. Suppliers, including Canada, Mexico, and European Union countries, have exemptions, but the tax still adds cost to imports.
U.S. agricultural imports have expanded in recent decades, with most products coming from Canada, Mexico, the EU, and South America. Common agricultural imports include fruits and vegetables—especially those that are tropical or out-of-season—as well as nuts, coffee, spices, and beverages. Turmoil with Russia was again a large contributor to cost increases in agricultural trade, alongside extreme weather events and disruptions in the supply chain. Americans felt these price hikes directly at the grocery store.
The U.S. imports significantly more than it exports, and added costs to those imports are felt far beyond its ports. If import prices continue to rise, overall inflation would likely follow, pushing already high prices even further for American consumers.
Story editing by Shannon Luders-Manuel. Copy editing by Kristen Wegrzyn.
This story originally appeared on Machinery Partner and was produced and
distributed in partnership with Stacker Studio.
-

 Business5 months ago
mesh conference goes deep on AI, with experts focusing in on training, ethics, and risk
-

 Business4 months ago
Skill-based hiring is the answer to labour shortages, BCG report finds
-

 Events6 months ago
Top 5 tech and digital transformation events to wrap up 2023
-

 People4 months ago
How connected technologies trim rework and boost worker safety in hands-on industries
-

 Events3 months ago
The Northern Lights Technology & Innovation Forum comes to Calgary next month