
Business
Best Southern small towns to live in
Whether considering a new move or just daydreaming of living in a town with a dose of Southern charm, Stacker has you covered with a list of the best suburban or rural areas of the South.
The U.S. South, considered by the U.S. Census Bureau to start at Maryland and Delaware, and then stretch all the way west to Texas and Oklahoma, is one of the fastest-growing regions in the U.S., and was, even before the COVID-19 pandemic hit.
Known for its hospitality, regional cuisines, and sprawling landscapes, the region boasts many towns with family-friendly historic attractions and outdoor activities. Some suburban and rural areas offer residents a crime-free life with great public education and job options.
Stacker referenced Niche’s 2022’s “Best Places to Live” study, narrowed the results to the American South—and then narrowed them further to the suburbs or rural areas, those towns with under 5,000 residents. Niche rated the best places to live according to factors such as cost of living, safety, and access to healthy living, good jobs, and education.
While this data is the most current available, some housing statistics Niche uses to calculate its rankings, such as median home values and housing costs, are not entirely reflective of the current housing market.
![]()
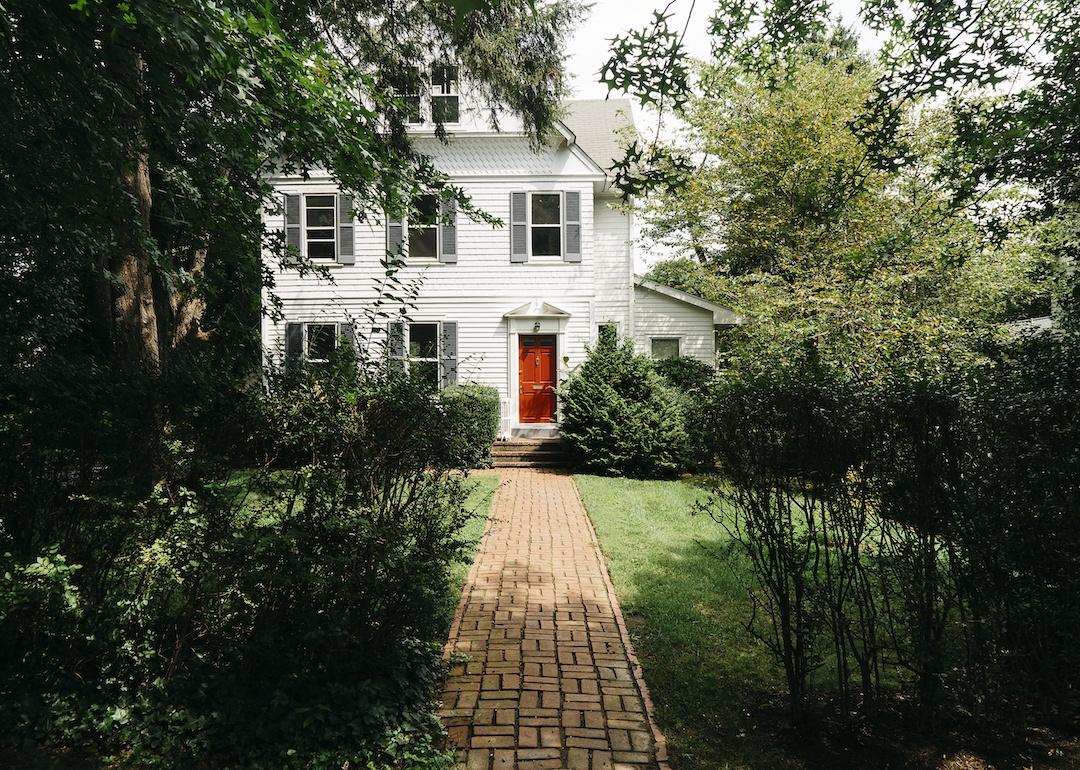
Nicole Glass Photography // Shutterstock
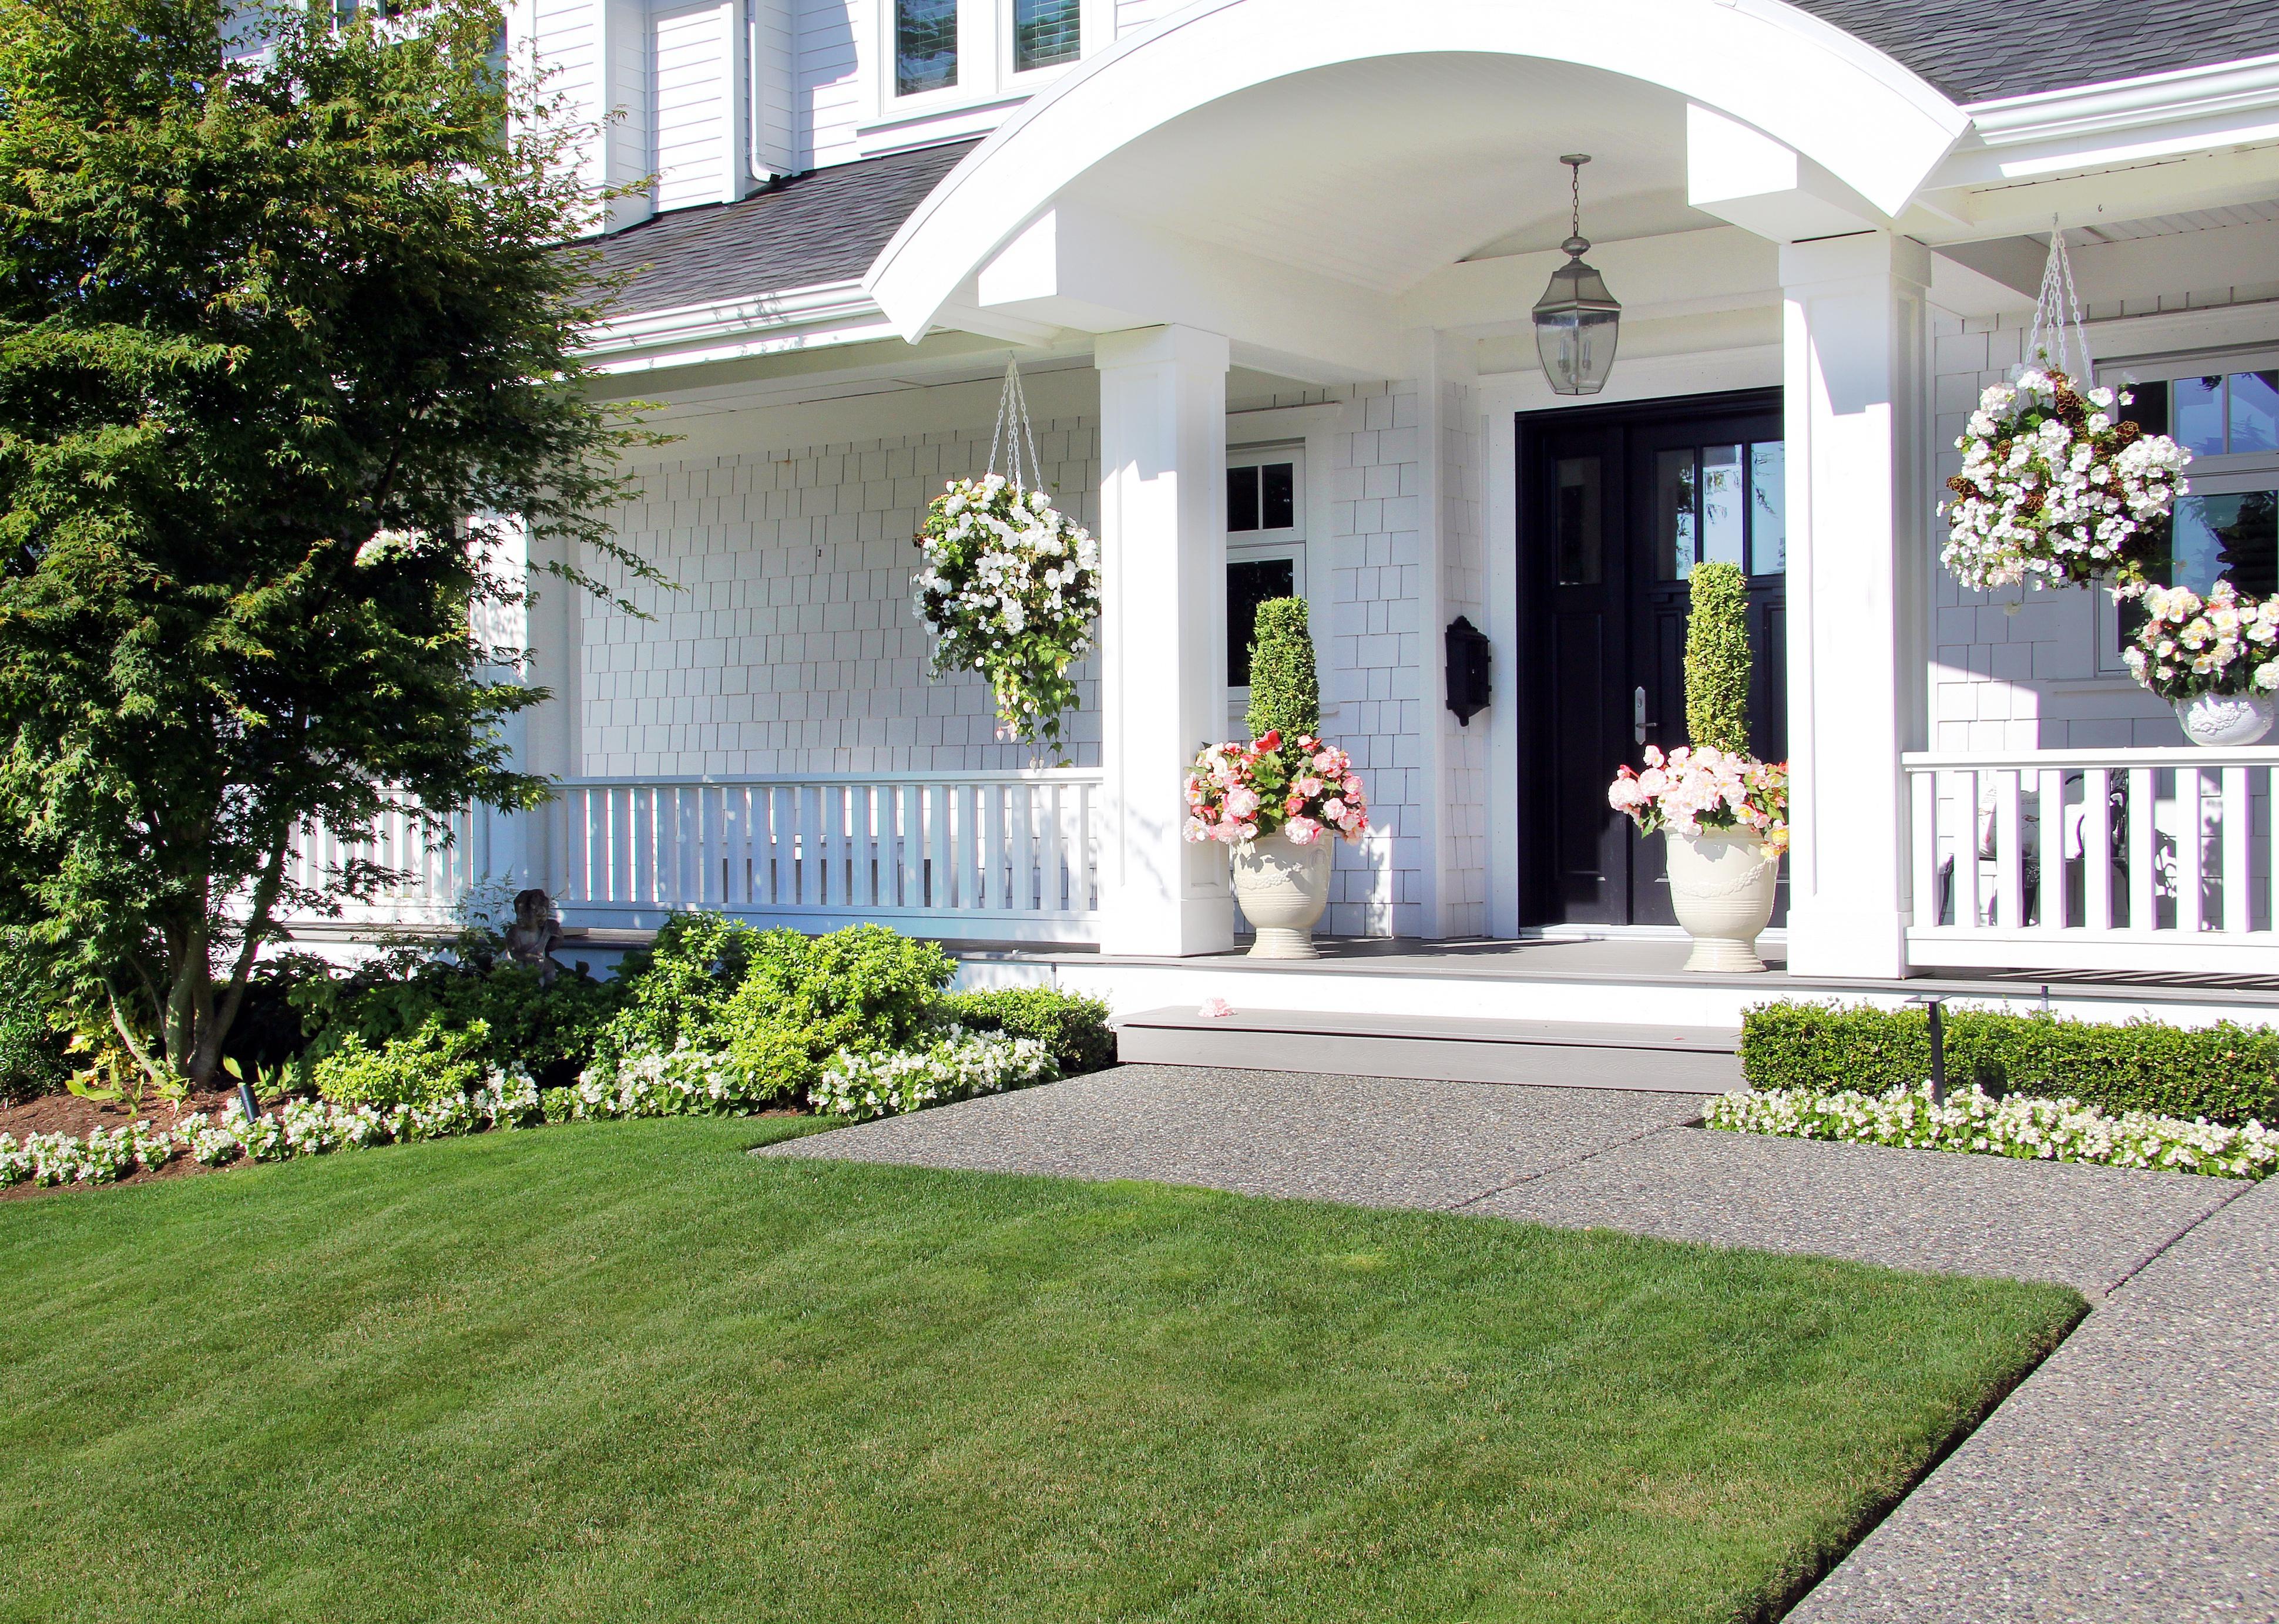
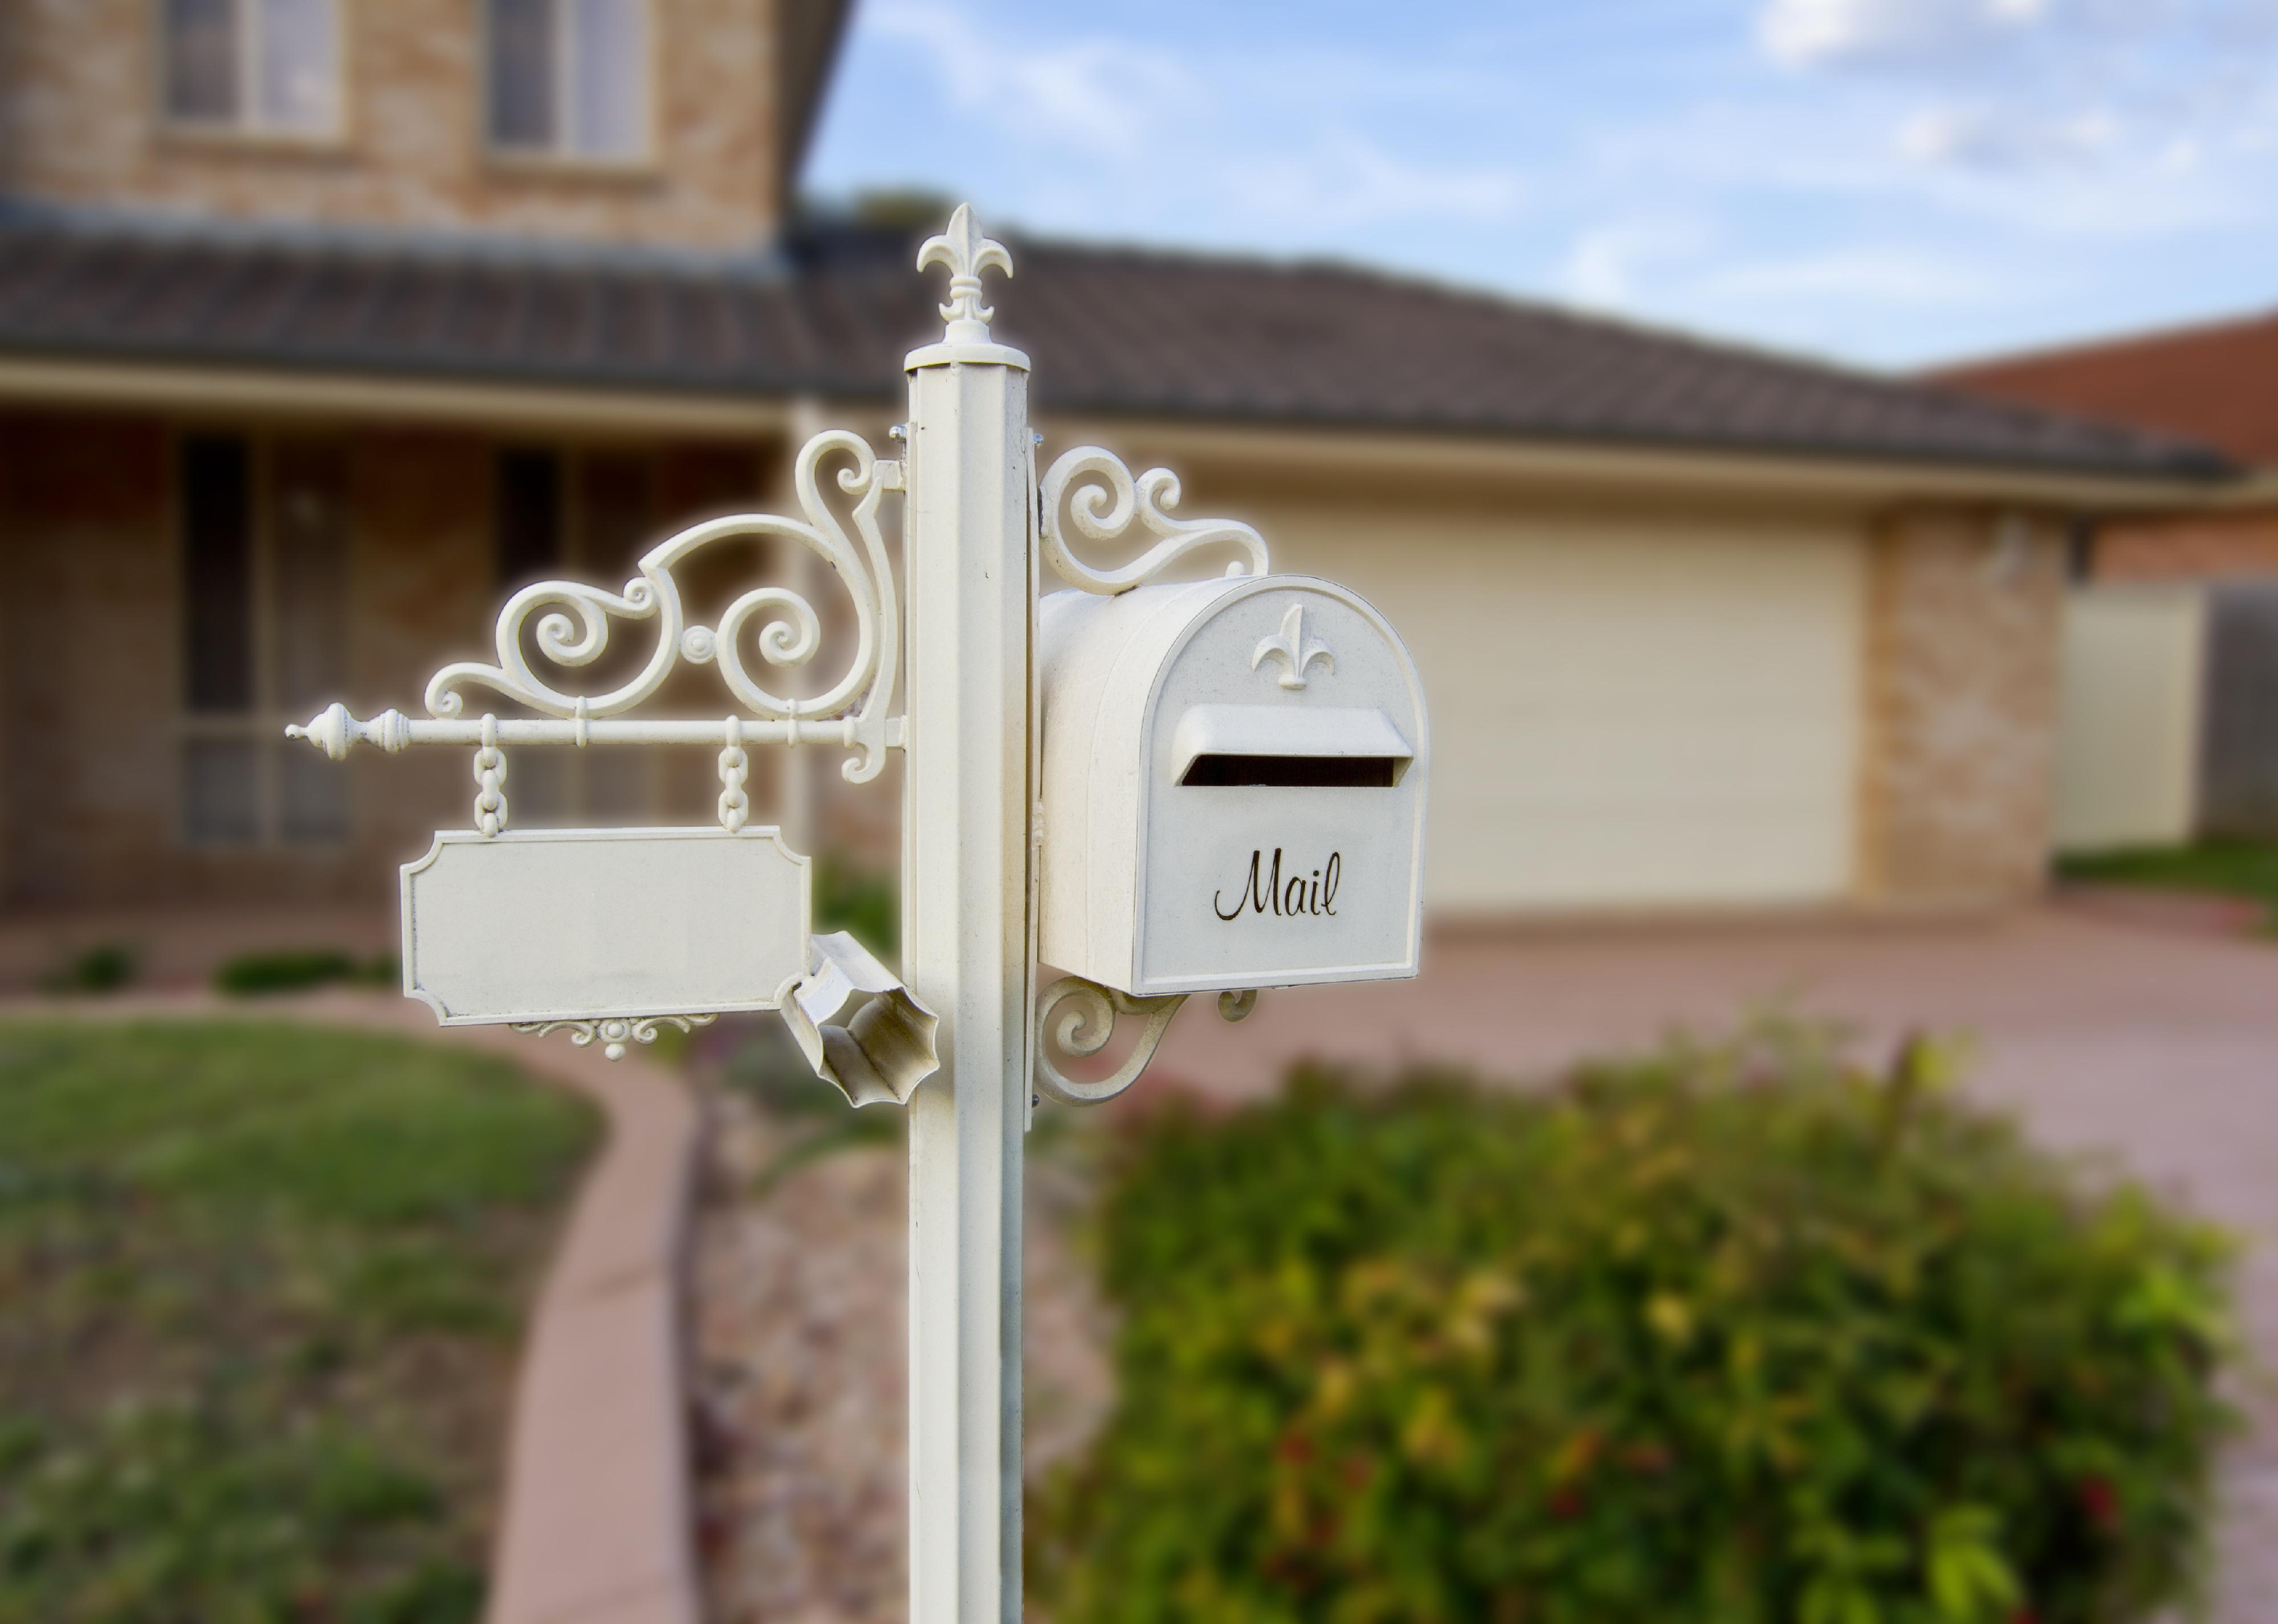
#25. Chevy Chase Town, Maryland
– Population: 2,913
– Median home value: $1,383,400 (97% own)
– Median rent: $3,501 (3% rent)
– Median household income: $250,001
Chevy Chase Town offers its residents a rural feel, according to Niche. More than two-thirds of residents have master’s degrees, and the public schools are ranked in the top 20 in the state. Housing prices are far above national averages. It’s a close-in suburb of Washington D.C., with easy public-transit access to any of the parks and attractions in the nation’s capital.
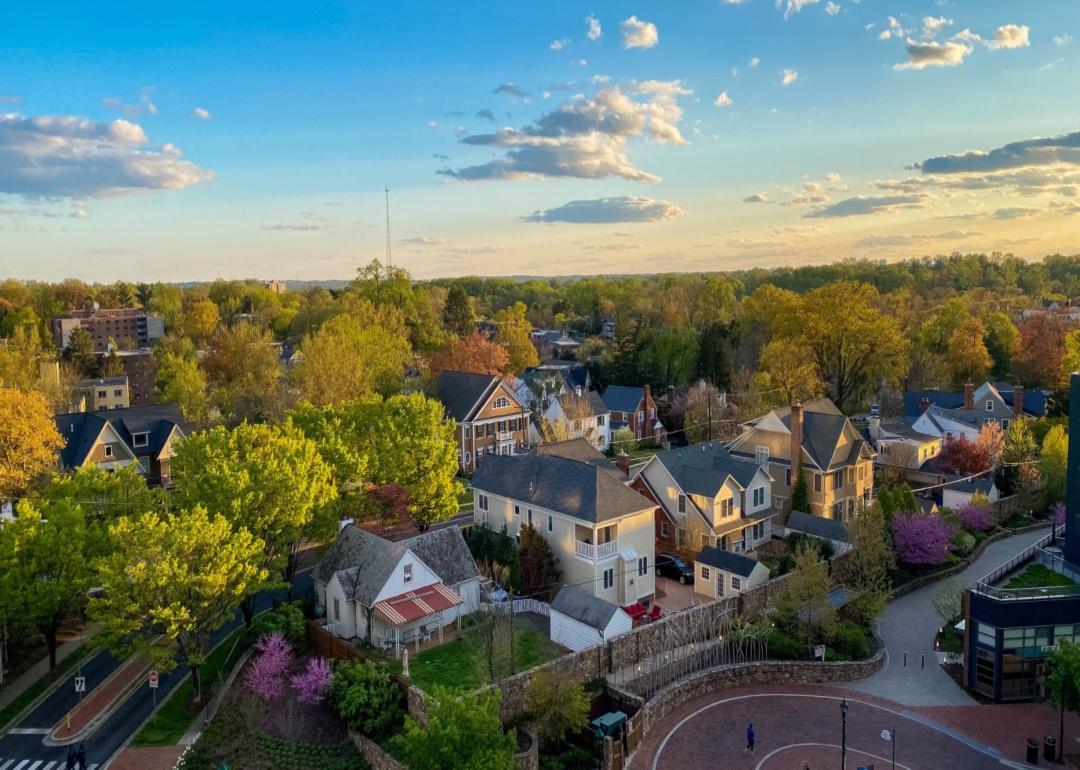
Mark Taylor Cunningham // Shutterstock
#24. Taylor Lake Village, Texas
– Population: 3,694
– Median home value: $289,700 (94% own)
– Median rent: $2,555 (6% rent)
– Median household income: $138,438
Niche ranks Taylor Lake Village, a suburb of Houston, as the best suburb for buying a house in the Houston area. It’s a great place for outdoor activities, raising a family, and housing, and offers a decent nightlife. There are waterfront homes on two lakes, a large shoreline community park, and a strong volunteering spirit.
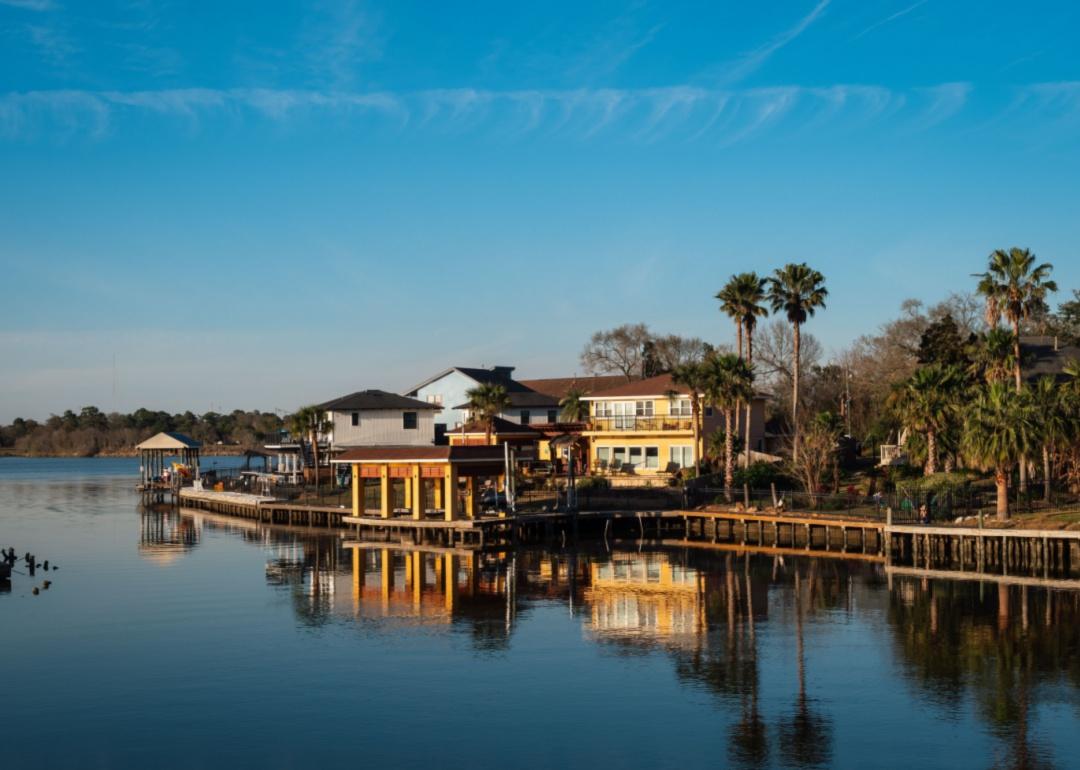
Canva
#23. Riverview, South Carolina
– Population: 1,989
– Median home value: $447,800 (60% own)
– Median rent: $578 (40% rent)
– Median household income: $116,840
Ranked by Niche as the best place to buy a house in South Carolina, Riverview, a suburb of Charlotte, is a great place to raise families. Jobs, schools, housing, and the cost of living all get A+ grades. However, residents must travel to Charlotte to do most shopping or to enjoy some nightlife.

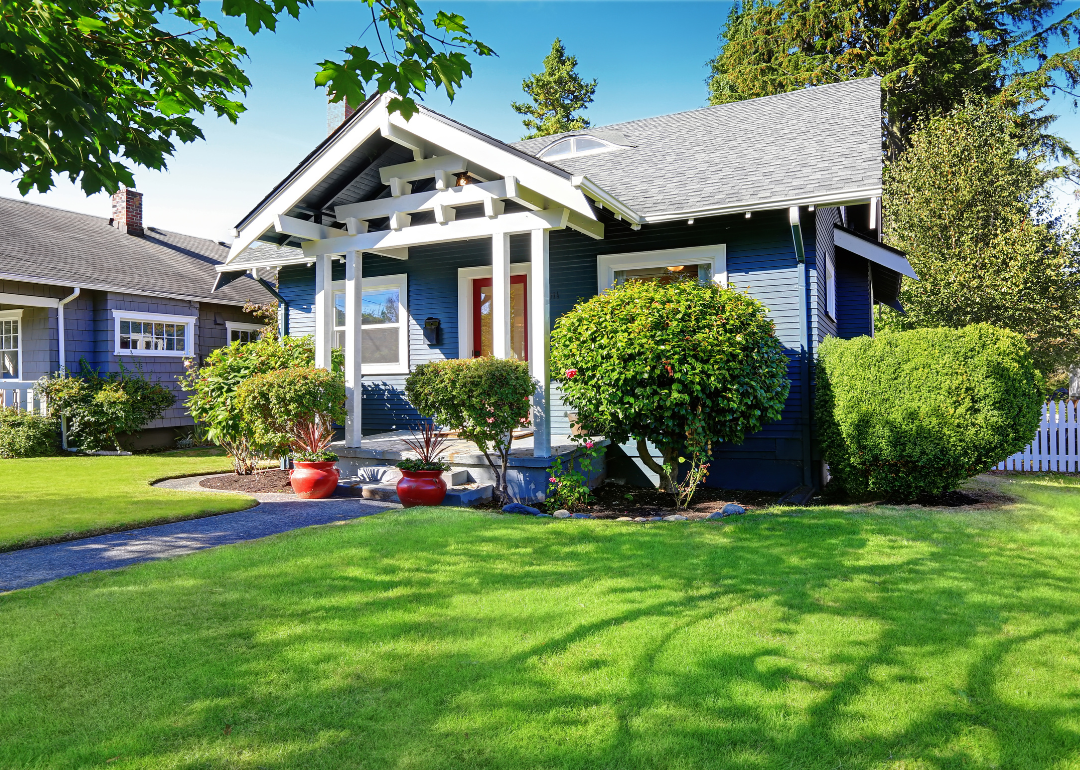
ElenaAdanPhotography // Shutterstock
#22. Avondale Estates, Georgia
– Population: 3,494
– Median home value: $442,300 (87% own)
– Median rent: $1,647 (13% rent)
– Median household income: $122,009
Niche ranks Avondale Estates as the seventh best place to retire in Georgia. It’s just east of Atlanta and is described as having a “sparse suburban feel.” Niche also reports Avondale Estates has relatively low crime and is a great place for families, outdoor activities, public education, and job prospects. It’s home to the unique Waffle House Museum. Other nearby attractions include the science exhibitions at the Fernbank Museum for dinosaur fossils, the Fernbank Science Center for hands-on experiences, or hiking trails through the Fernbank Forest.
Hannamariah // Shutterstock
#21. Olmos Park, Texas
– Population: 2,432
– Median home value: $703,400 (79% own)
– Median rent: $1,087 (21% rent)
– Median household income: $146,944
Olmos Park, located north of downtown San Antonio, was developed in the 1920s. H.C. Thorman, a renowned real-estate developer and oilman from Ohio, purchased the property and built homes, creating this posh enclave. Thorman used stone veneer over structural concrete to evoke the style of English stone cottages in the homes he built, many of which still exist.
STONE8HENGE // Wikimedia Commons
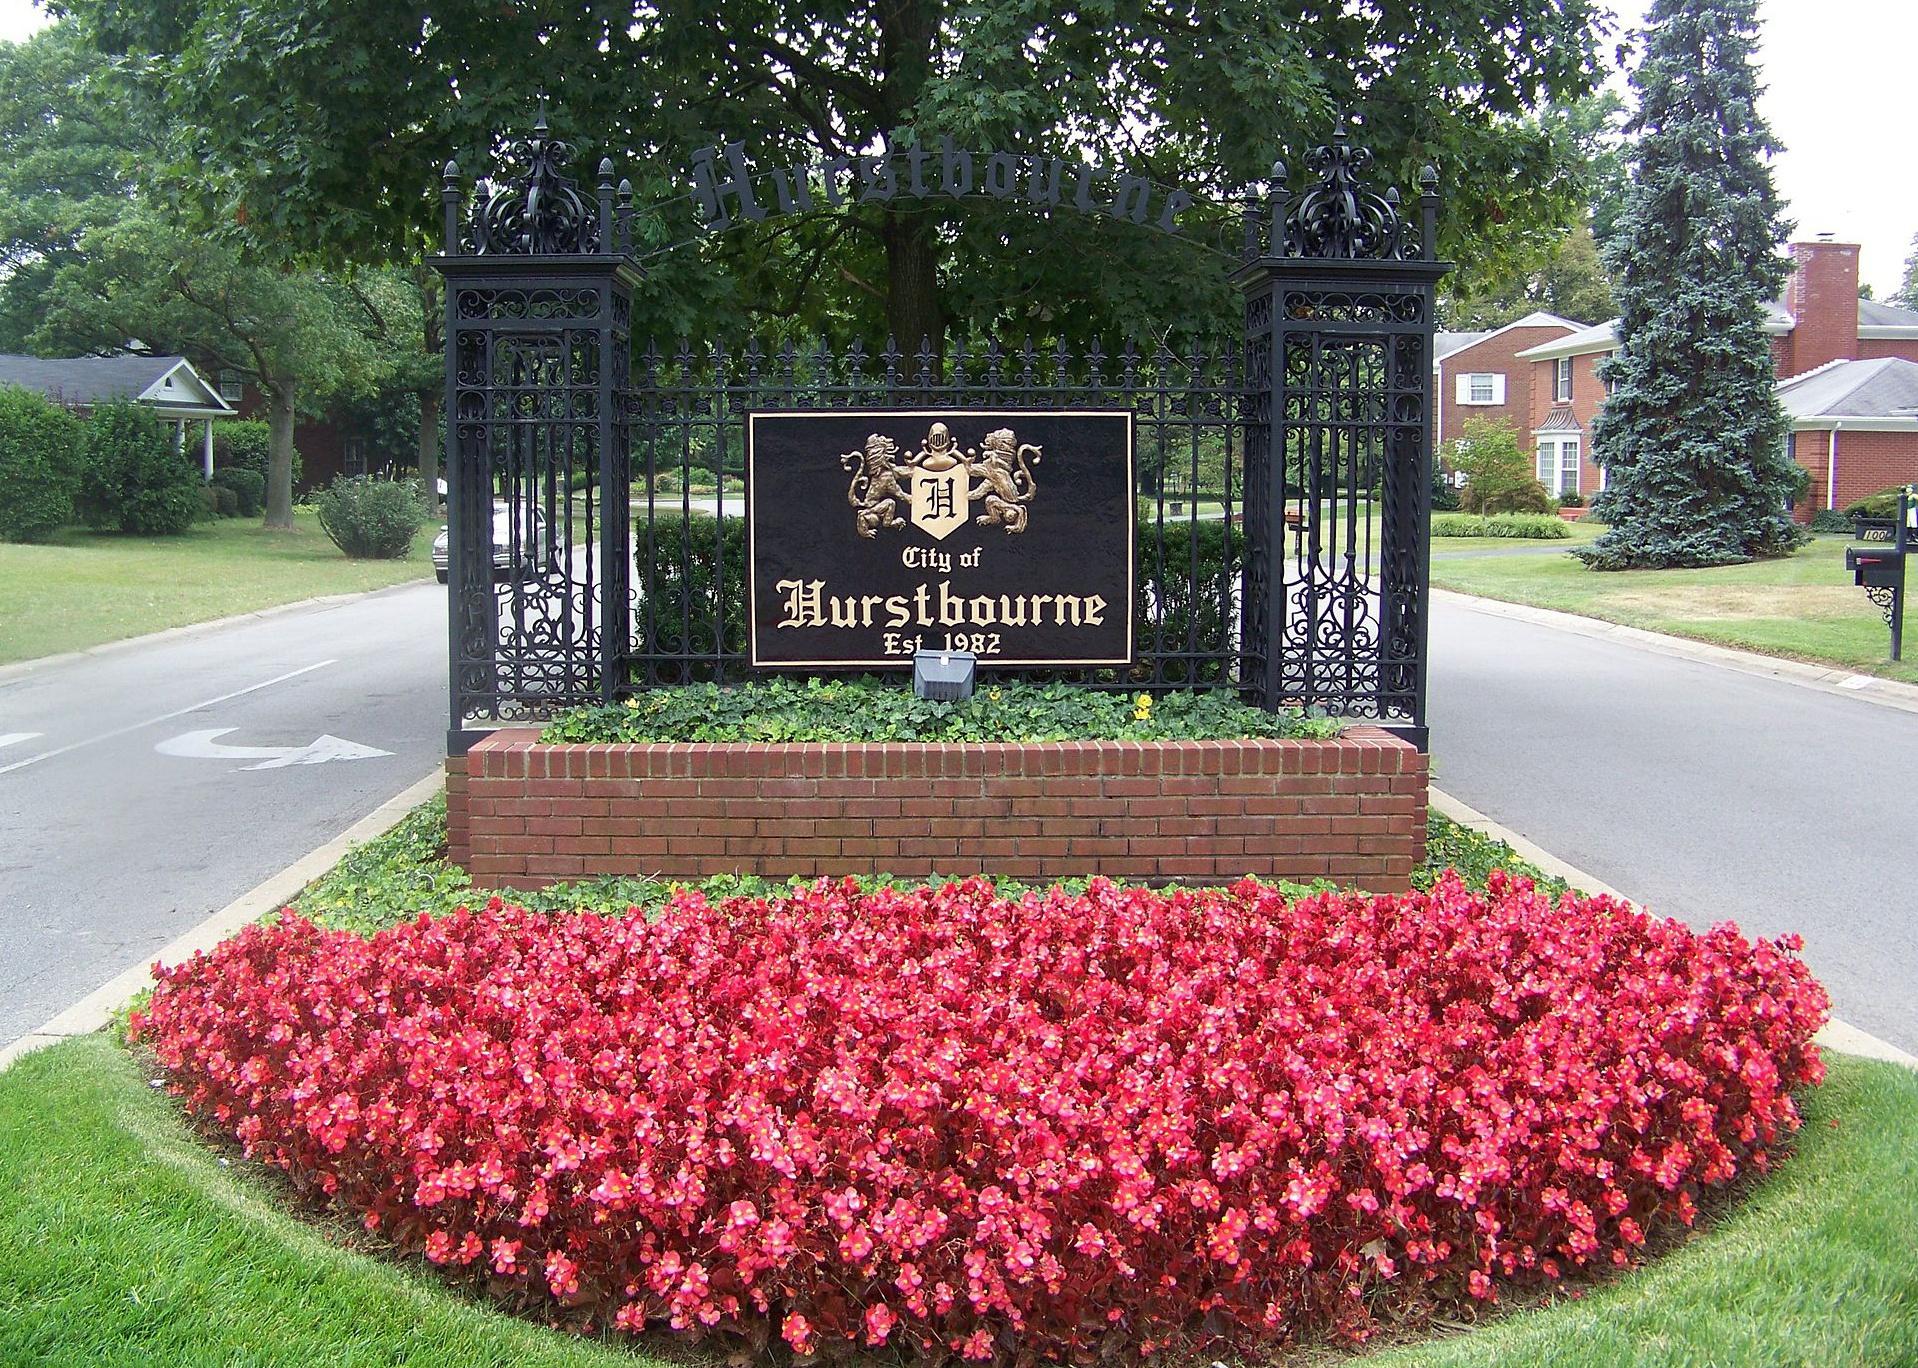
#20. Hurstbourne, Kentucky
– Population: 4,644
– Median home value: $441,200 (63% own)
– Median rent: $1,370 (37% rent)
– Median household income: $107,423
Though the area was first settled in 1779, the town didn’t really begin until the mid-1960s as an extension of the growth of nearby Louisville. Today, the primarily residential community has a country club at its center, with commercial activity primarily right along its edges.
Spiroview Inc // Shutterstock
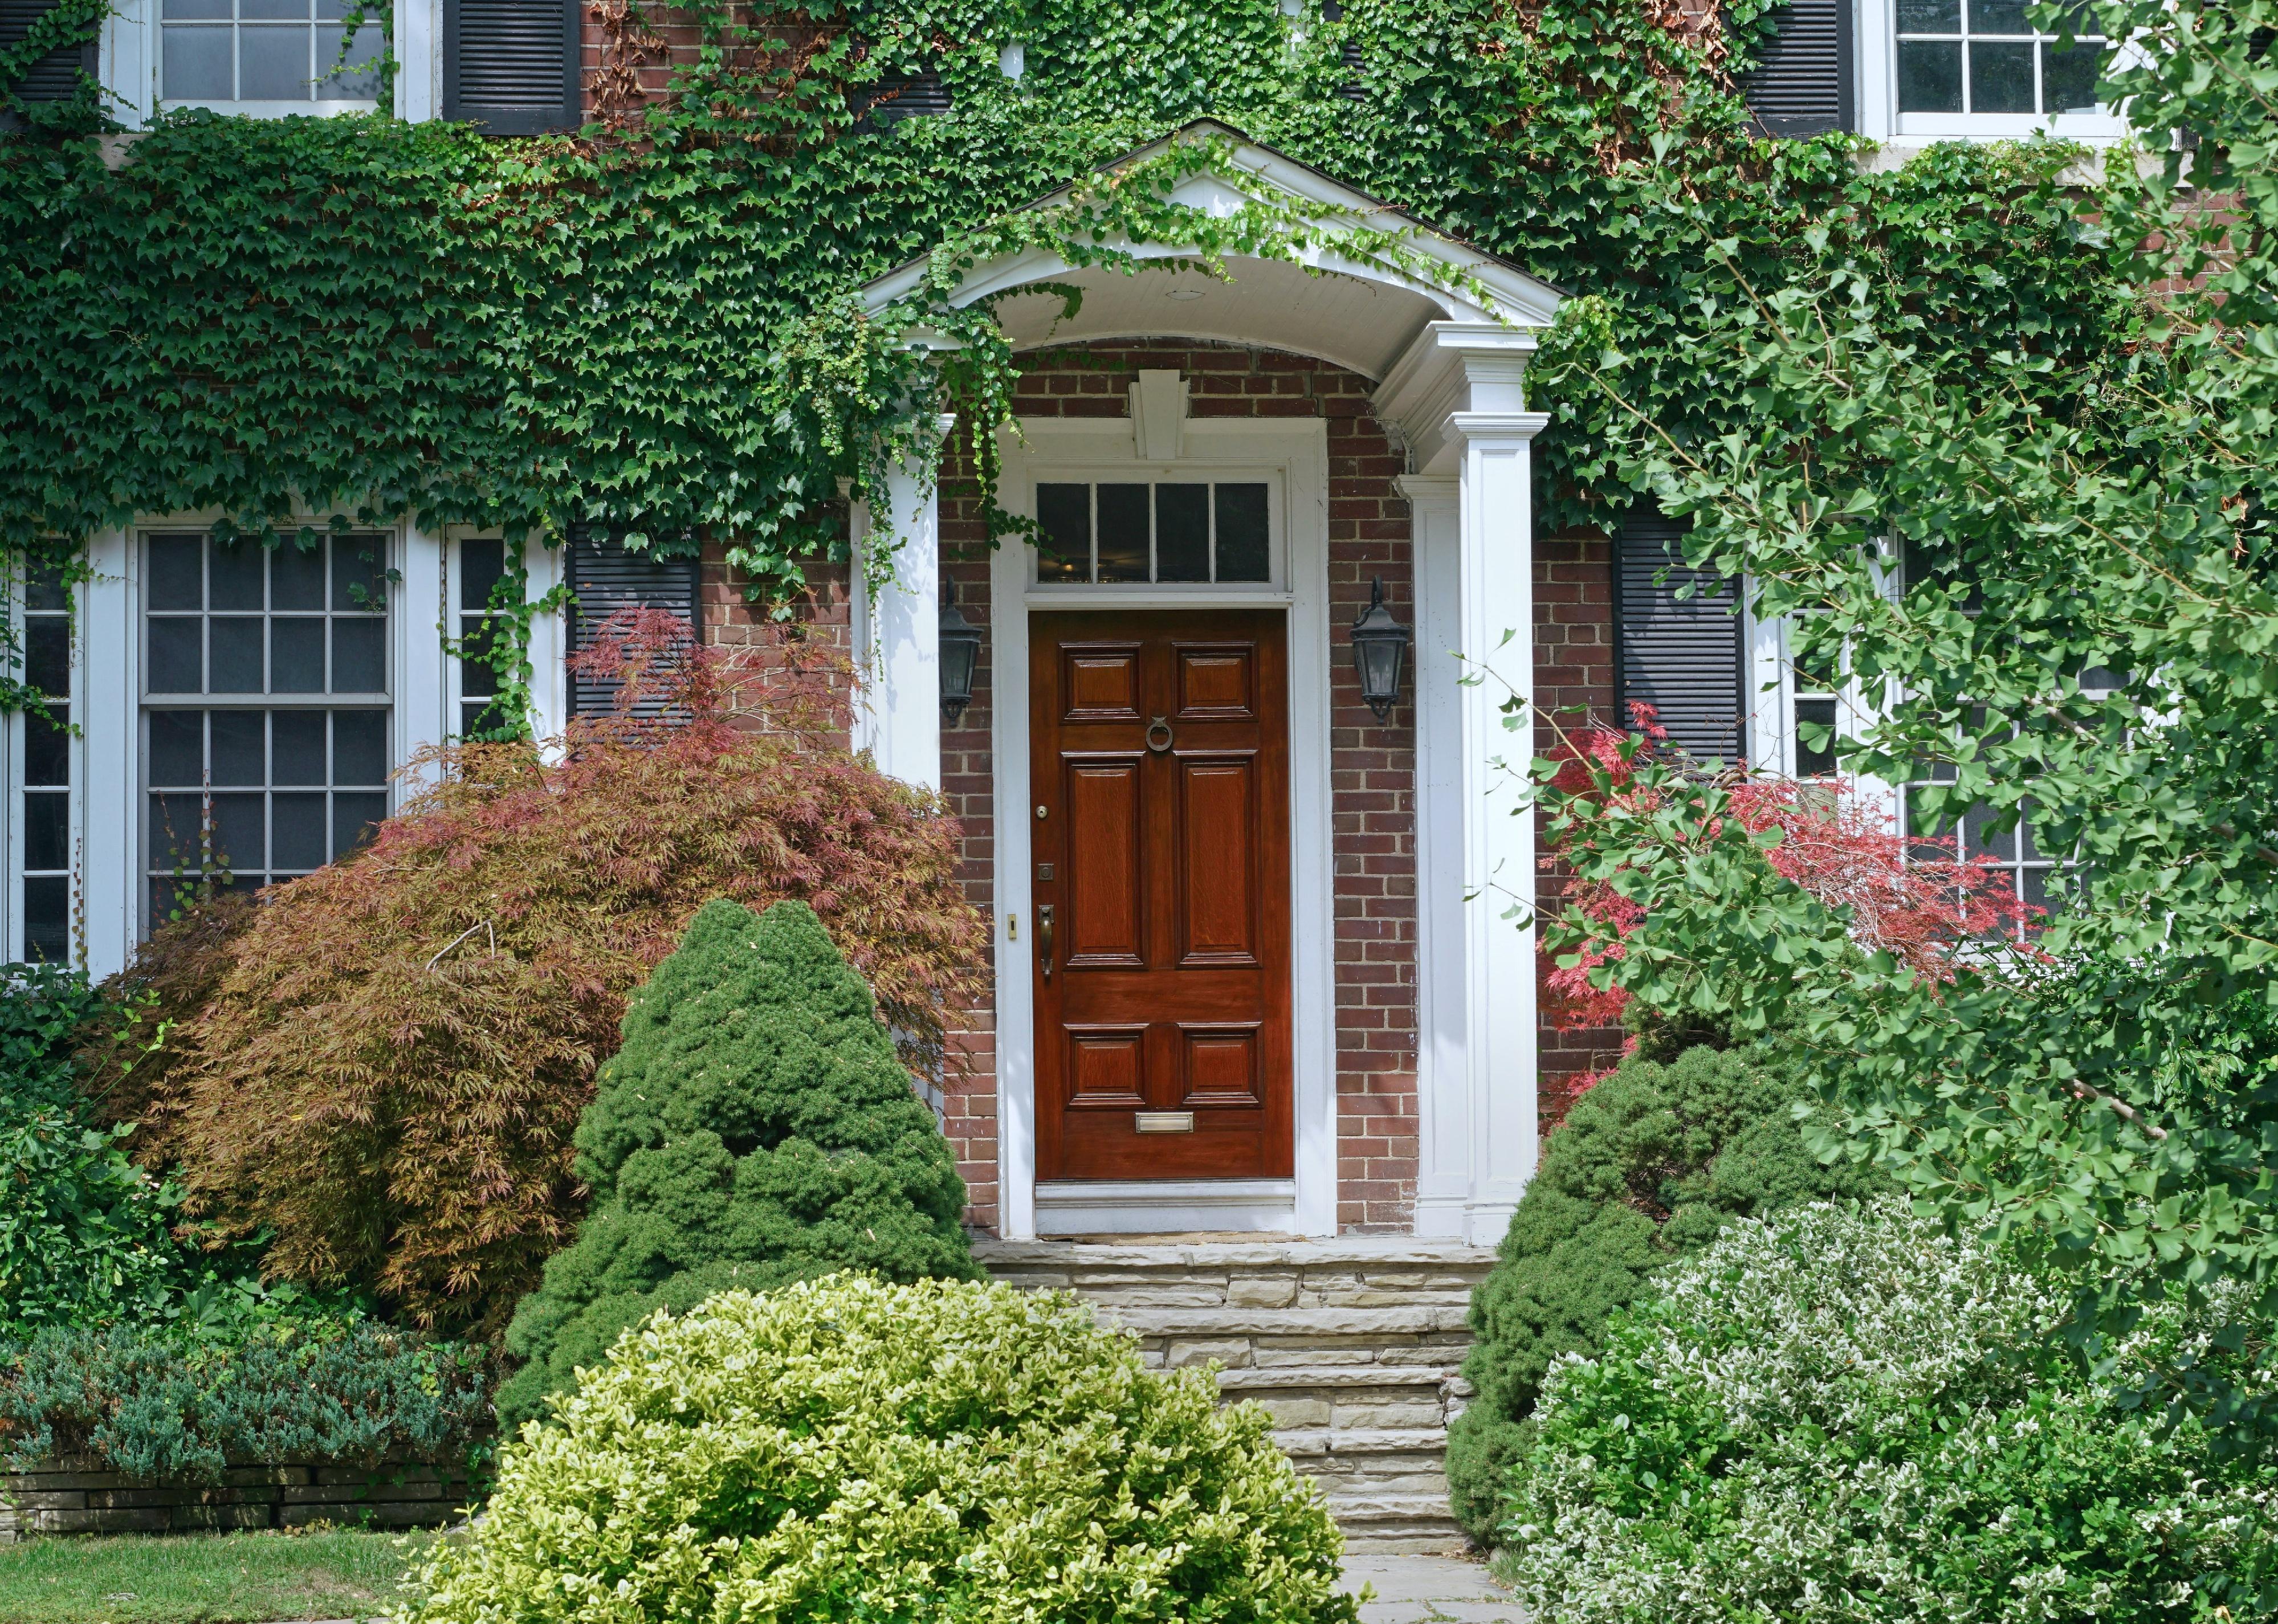
#19. Indian Hills, Kentucky
– Population: 2,878
– Median home value: $609,100 (100% own)
– Median rent: No data available
– Median household income: $163,750
A suburb of Louisville, Indian Hills provides a rural feel while with accessibility to coffee shops and restaurants. Two sons of noted landscape architect Frederick Law Olmsted designed several wooded areas in town. Almost everyone in town owns their home.
WhisperToMe // Wikimedia Commons
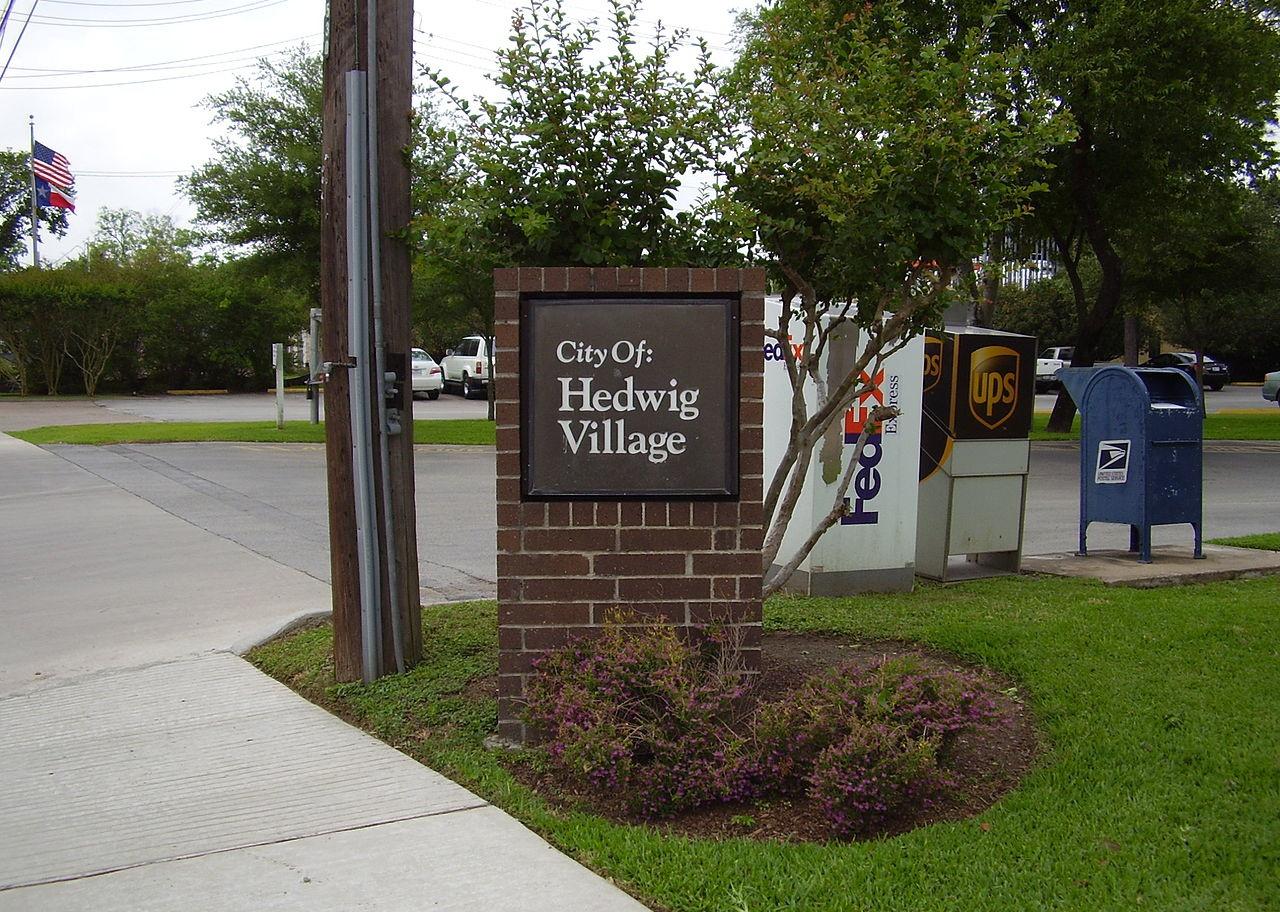
#18. Hedwig Village, Texas
– Population: 2,343
– Median home value: $1,200,900 (73% own)
– Median rent: $1,201 (27% rent)
– Median household income: $166,250
A suburb of Houston, Hedwig Village offers its residents a diverse urban-suburban feel with a commercial district alongside I-10, and wooded lots throughout most of the rest of the 1-square-mile city. It has excellent public schools and is good for families, but housing prices are high, which increases the overall cost of living.
G. Edward Johnson // Wikimedia Commons
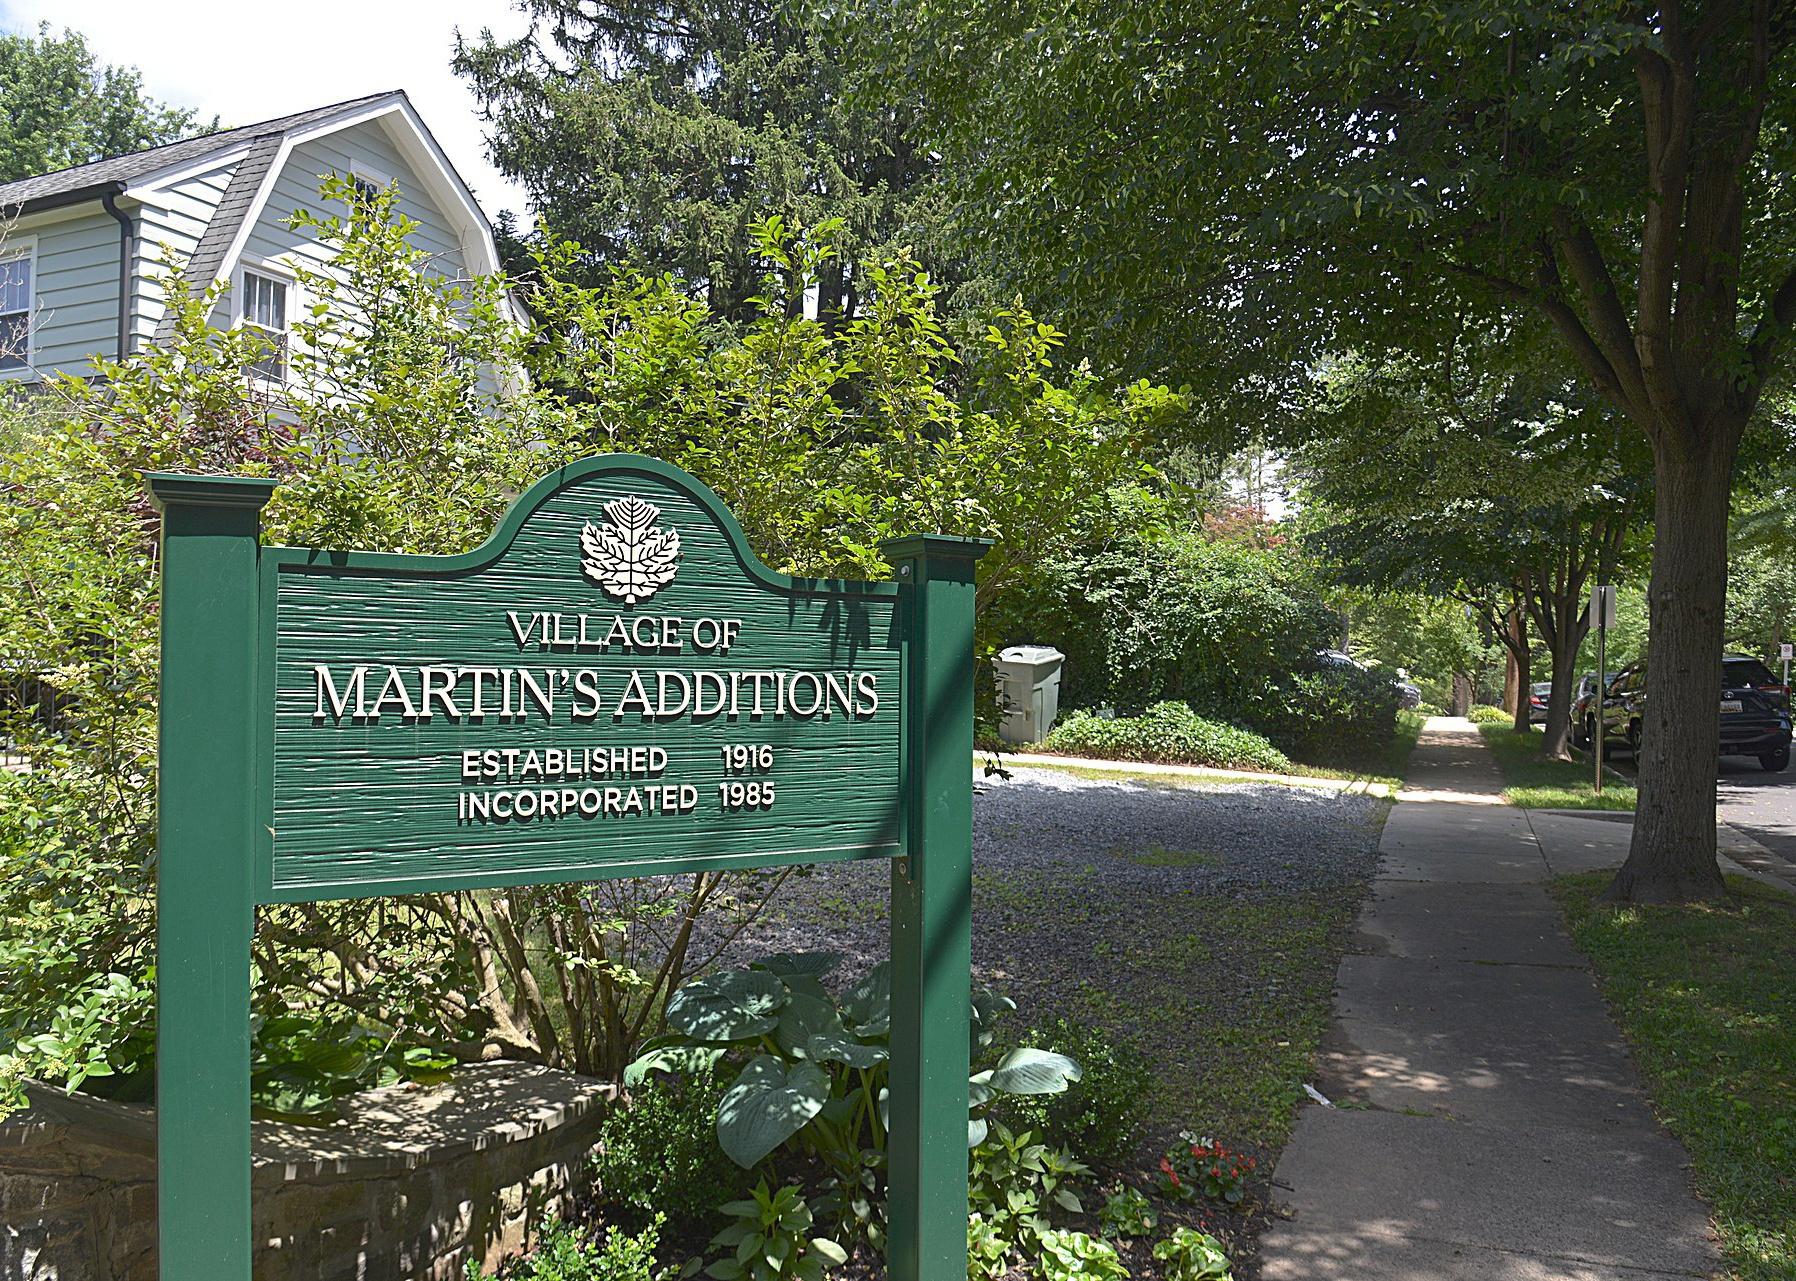
#17. Martin’s Additions, Maryland
– Population: 1,045
– Median home value: $1,252,700 (96% own)
– Median rent: $2,350 (4% rent)
– Median household income: $250,001
Harry Martin, an entrepreneur in the late 19th century, played a key role in the region’s development, including constructing homes on a 90-acre lot of land that became nicknamed—and later formally named—Martin’s Additions, because he advertised them as “additions” to neighboring Chevy Chase. Roughly 325 homes fill the village’s 14 streets. Residents have access to the excellent Montgomery County schools, and are close to several area parks.
WhisperToMe // Wikimedia Commons
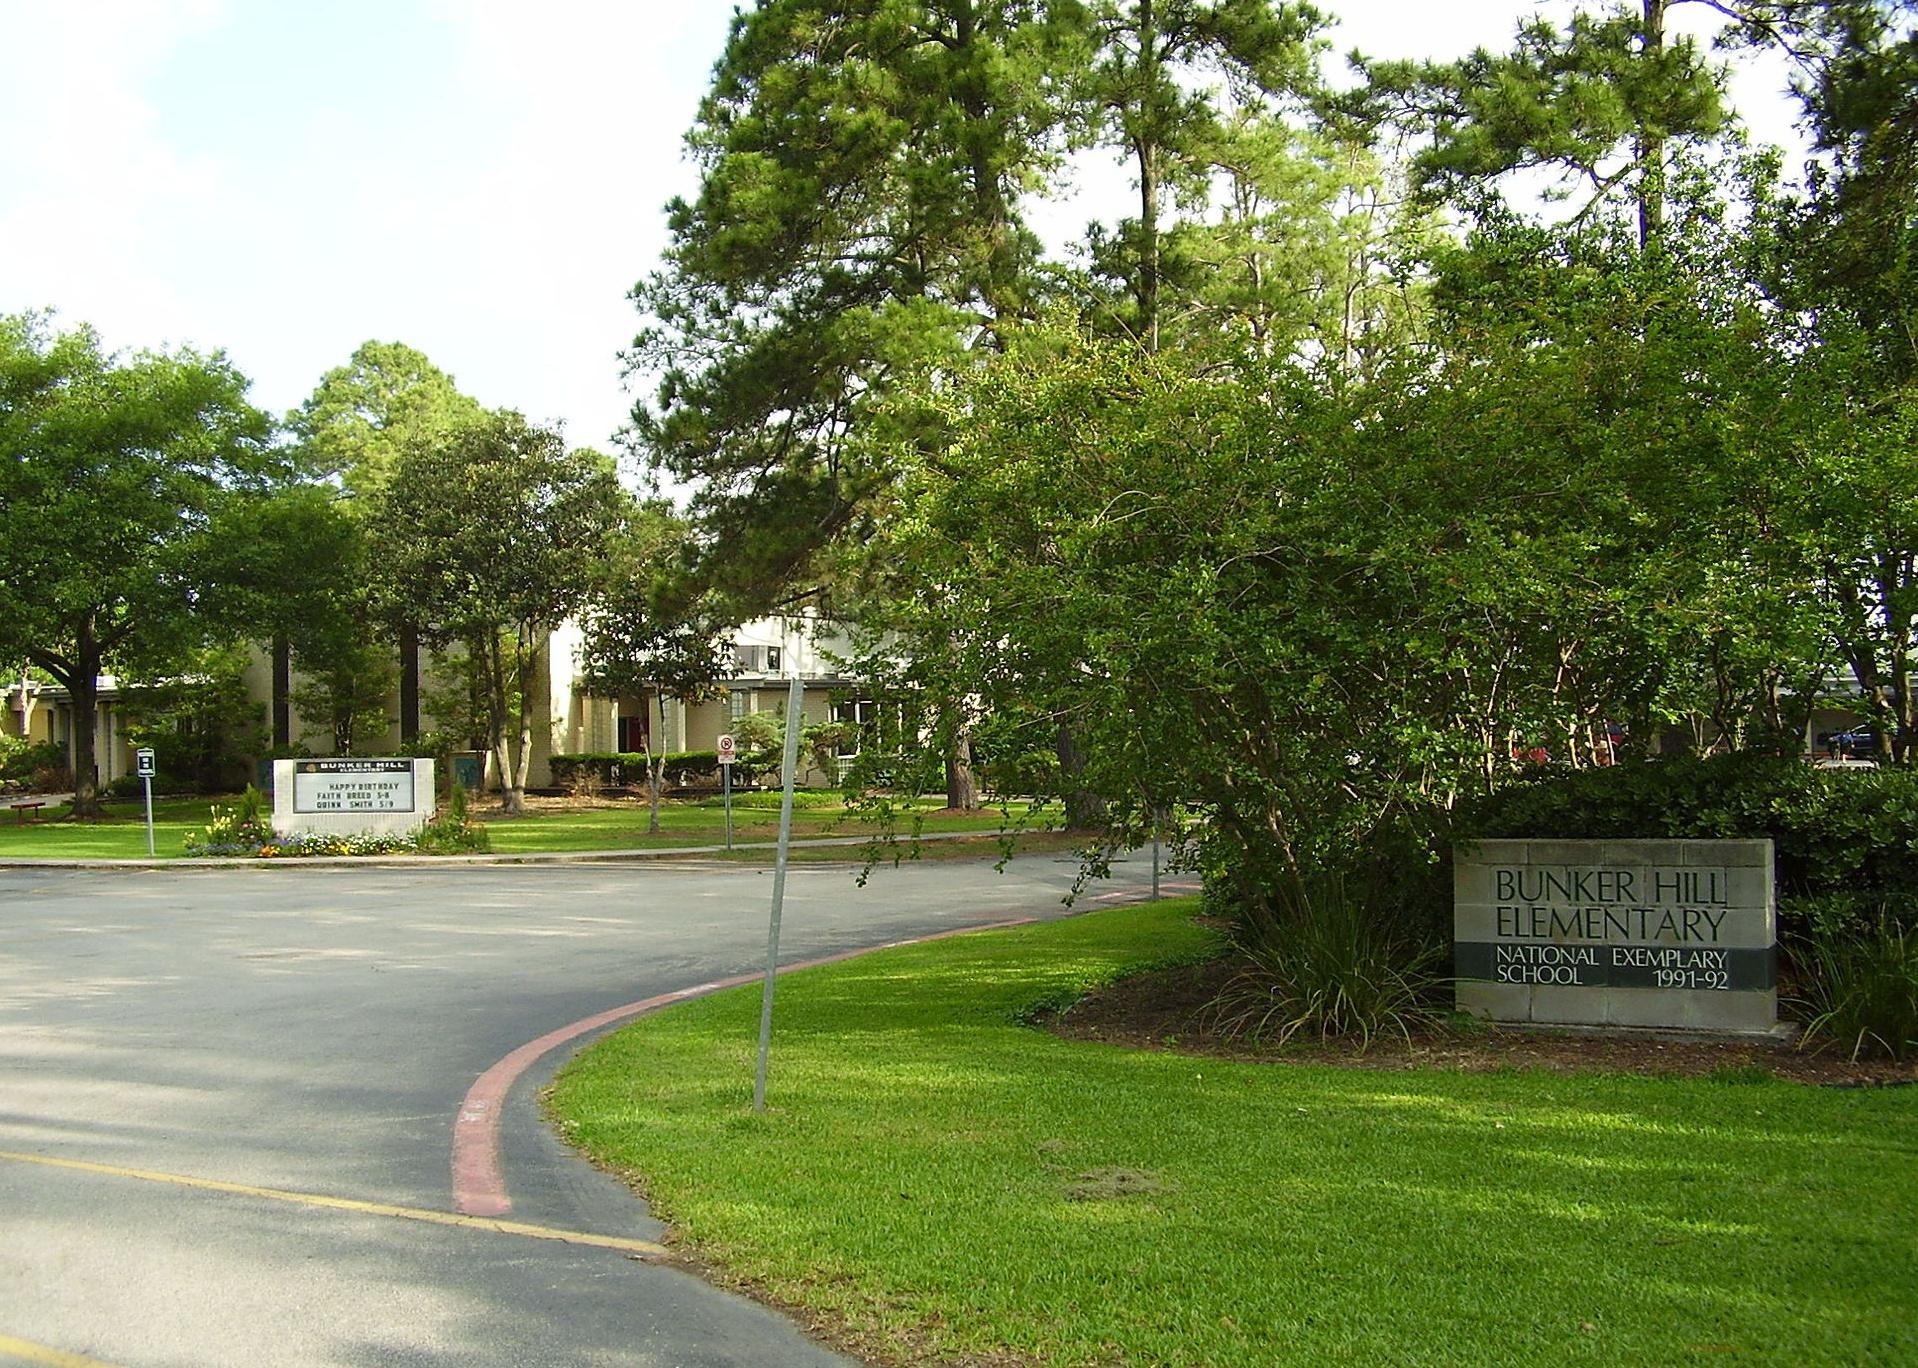
#16. Bunker Hill Village, Texas
– Population: 3,821
– Median home value: $1,645,400 (94% own)
– Median rent: $3,501 (6% rent)
– Median household income: $250,001
Bunker Hill Village, located in West Houston, was incorporated in 1954 and, by 1966, had become an affluent community with a growing population. Over the years, residents of Bunker Hill Village have adopted zoning ordinances and taken other measures to preserve their quiet, wooded neighborhood.
Northwalker // Wikimedia Commons
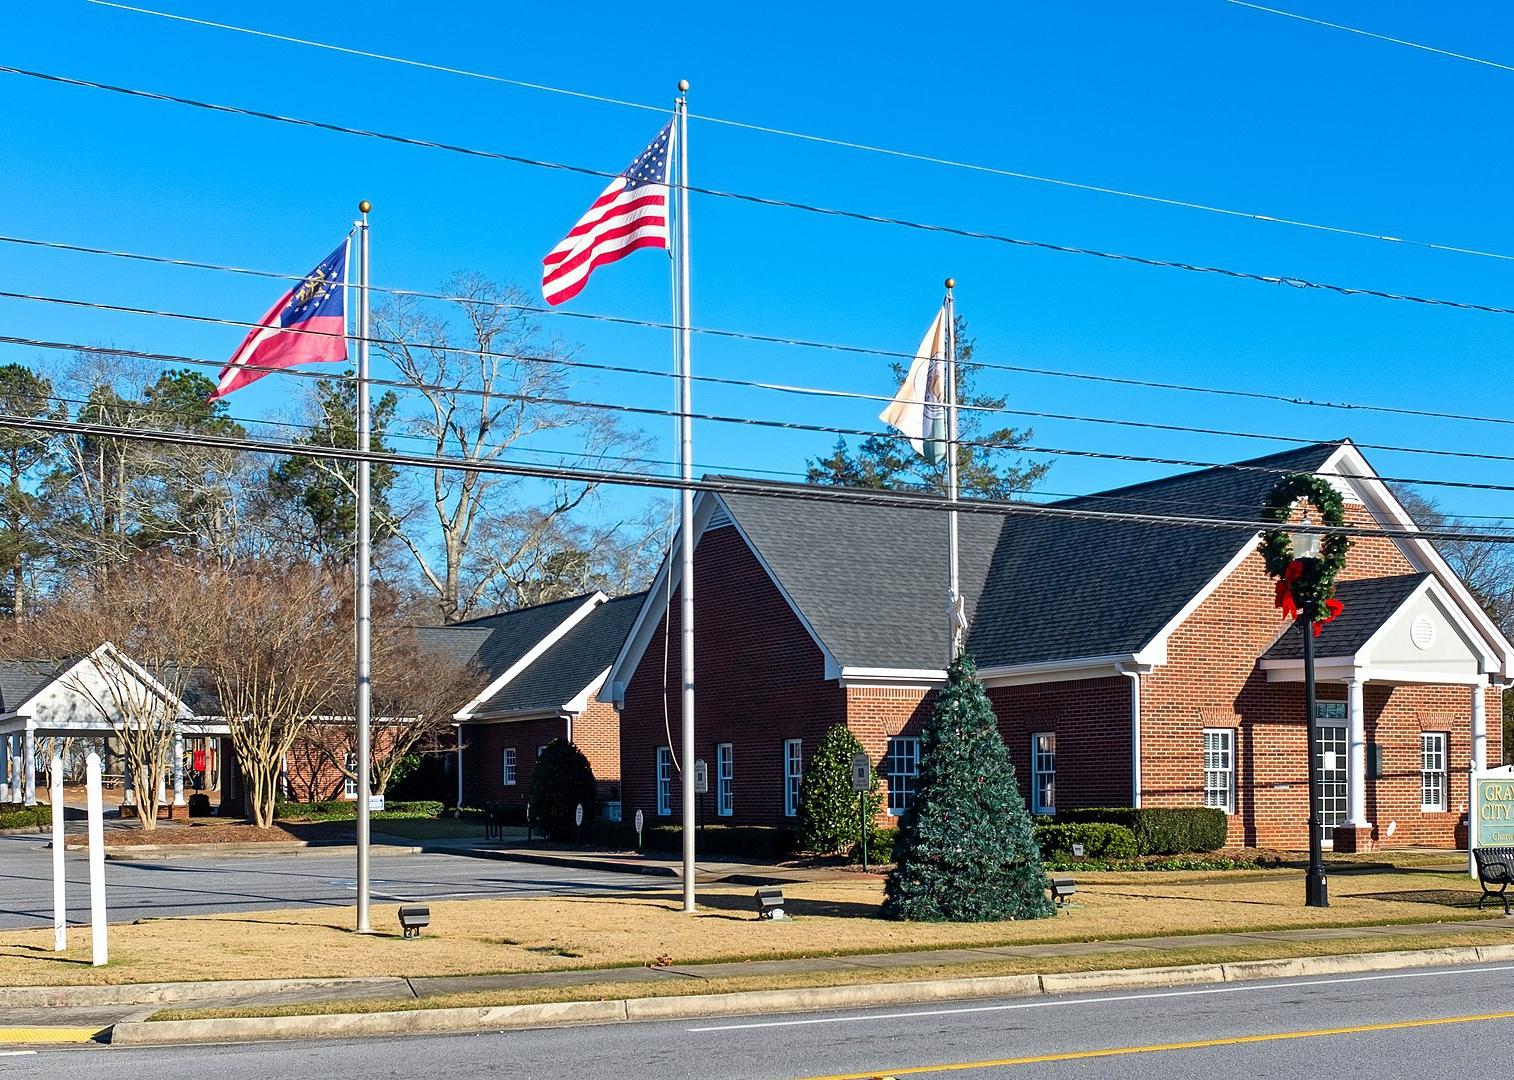
#15. Grayson, Georgia
– Population: 4,478
– Median home value: $350,200 (96% own)
– Median rent: $2,136 (4% rent)
– Median household income: $113,652
Grayson, a suburb of Atlanta, has quality schools, parks, coffee houses, restaurants, and shopping. Residents in the area are composed of families as well as single professionals.

Sean Pavone // Shutterstock
#14. Lookout Mountain, Georgia
– Population: 1,701
– Median home value: $387,000 (87% own)
– Median rent: $1,146 (13% rent)
– Median household income: $128,611
In an area known for hiking and breath-taking views, the small city of Lookout Mountain neighbors a town of the same name in Tennessee. Both are conveniently located near Chattanooga. Famous attractions in the area include the Blue Ridge Mountains, “Rock City,” a view of seven states, Civil War sites, and underground waterfalls. According to Niche, the annual median individual income is $48,380, more than $10,000 above the national average. And poverty and unemployment are below national averages.
G. Edward Johnson // Wikimedia Commons
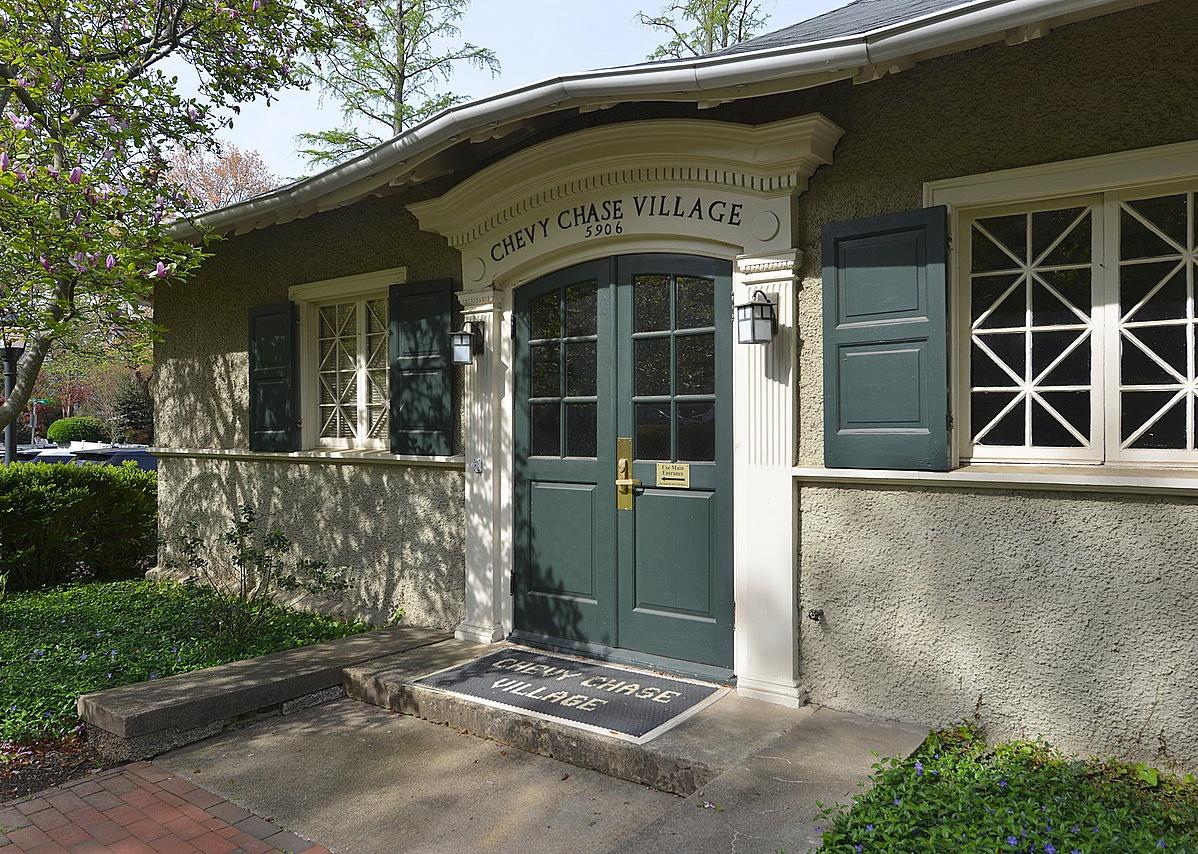
#13. Chevy Chase Village, Maryland
– Population: 1,858
– Median home value: $1,938,800 (98% own)
– Median rent: $3,450 (2% rent)
– Median household income: $250,001
Chevy Chase Village, a suburb of Washington D.C., is among the wealthiest in the state. It averages zero violent crimes a year, helping earn the community an A grade for crime and safety. And thefts, including vehicle thefts, are below the national average. But the village does have a burglary rate slightly above the national average.
Krishnadas // Shutterstock
#12. Prospect, Kentucky
– Population: 4,653
– Median home value: $426,300 (94% own)
– Median rent: $1,147 (6% rent)
– Median household income: $160,960
Most Prospect residents, whether families or single professionals, own their homes in this rural-feeling suburb northeast of Louisville. Outdoor activities within the city limits include horse riding, golf, paddling on Harrods Creek, and walking in the woods along the creek.
Farragutful // Wikimedia Commons
#11. Derwood, Maryland
– Population: 1,700
– Median home value: $546,300 (64% own)
– Median rent: $1,375 (36% rent)
– Median household income: $71,471
Despite being a small town, Derwood is accessible on the red line of the D.C. area’s Metro system, which allows people to commute to and from work in the nation’s capital. Overall, Derwood has a diverse community: 46% of its residents are internationally born, 33% are naturalized, and 53% are born in the U.S.
Artazum // Shutterstock
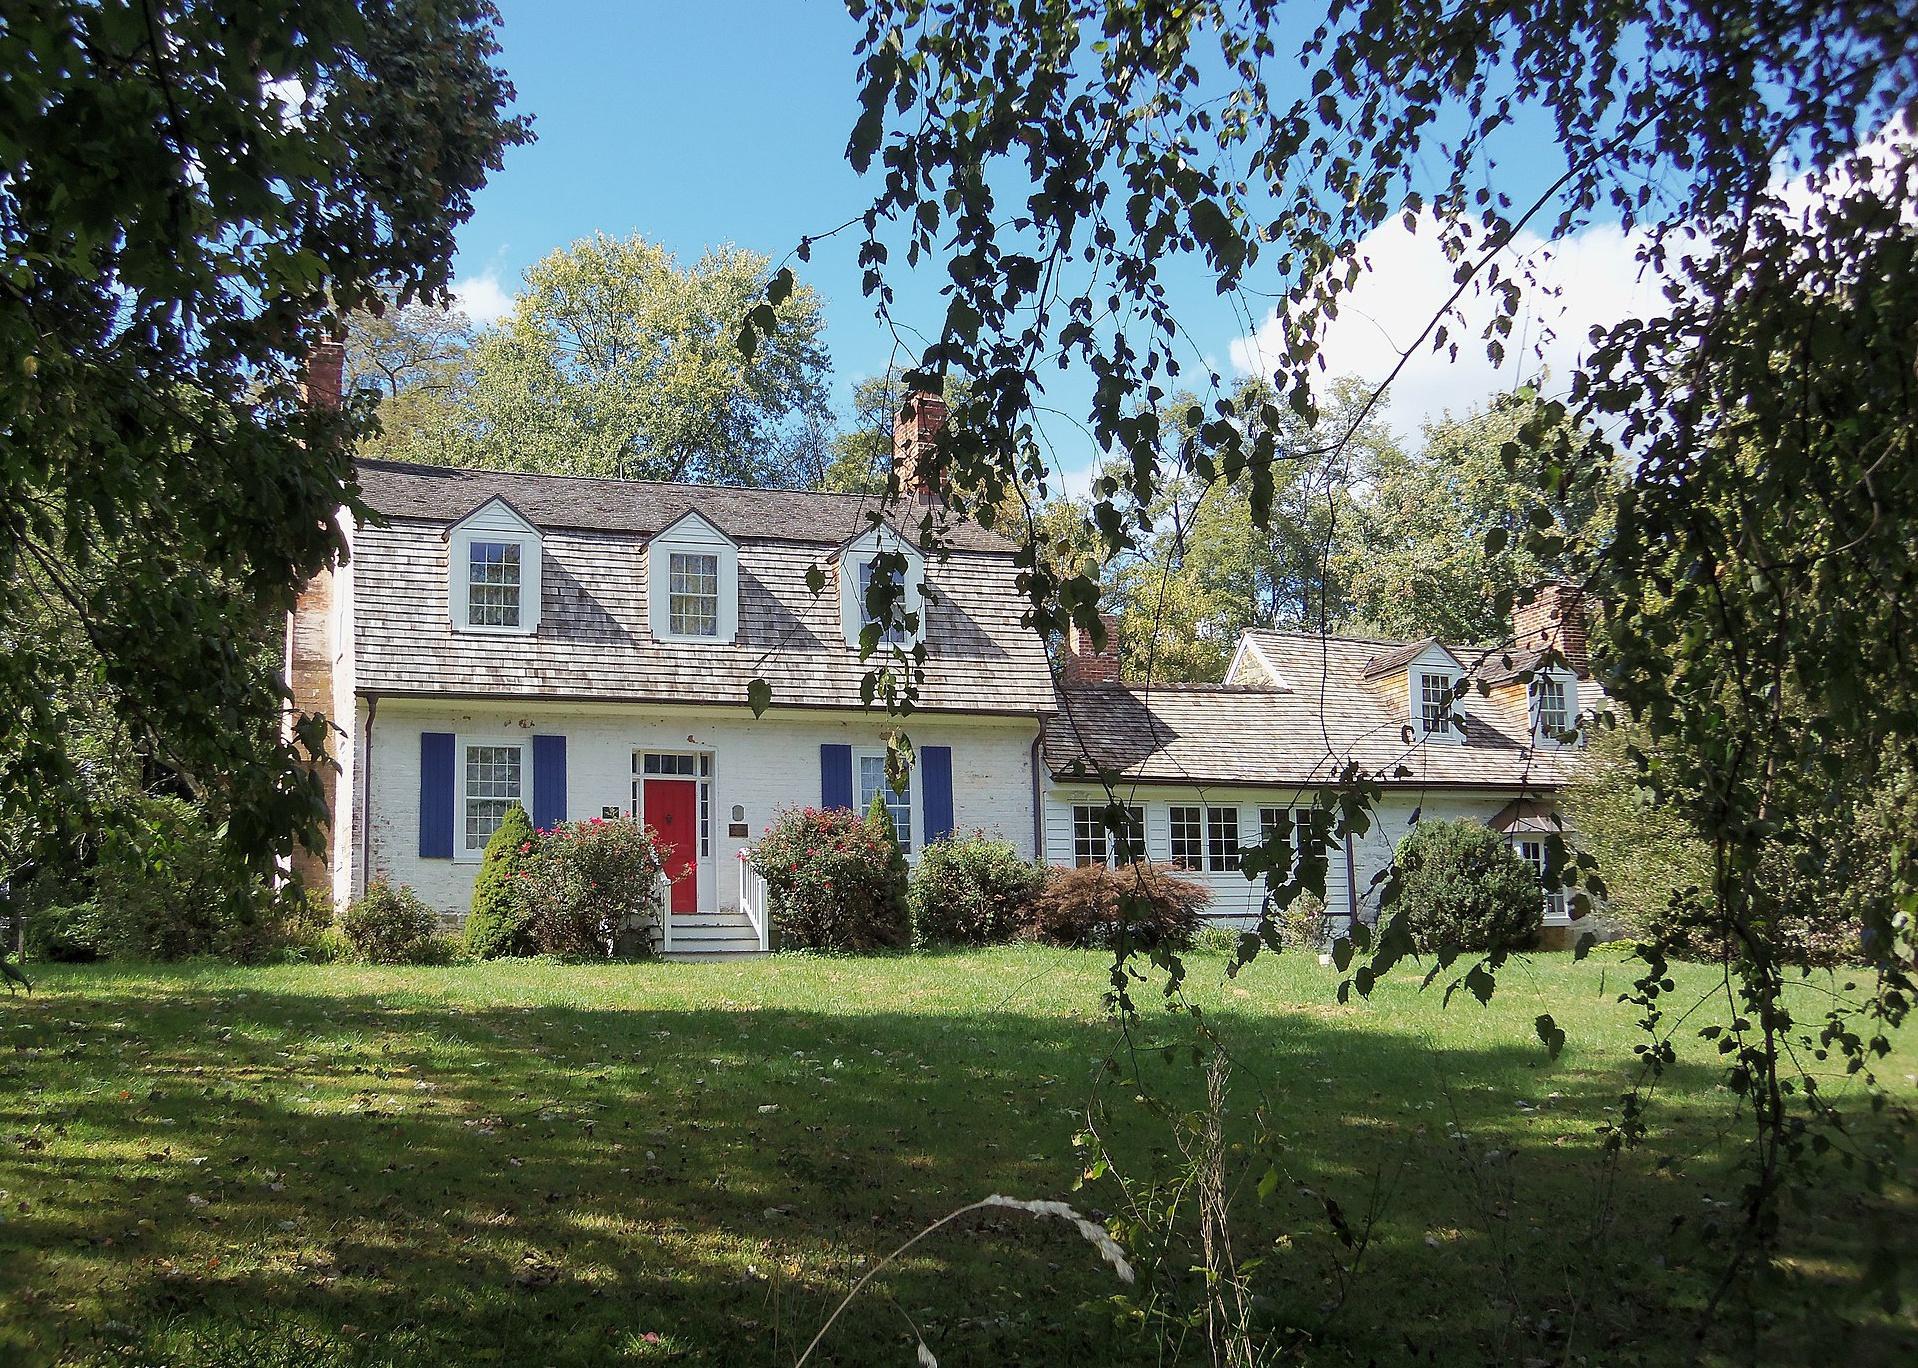
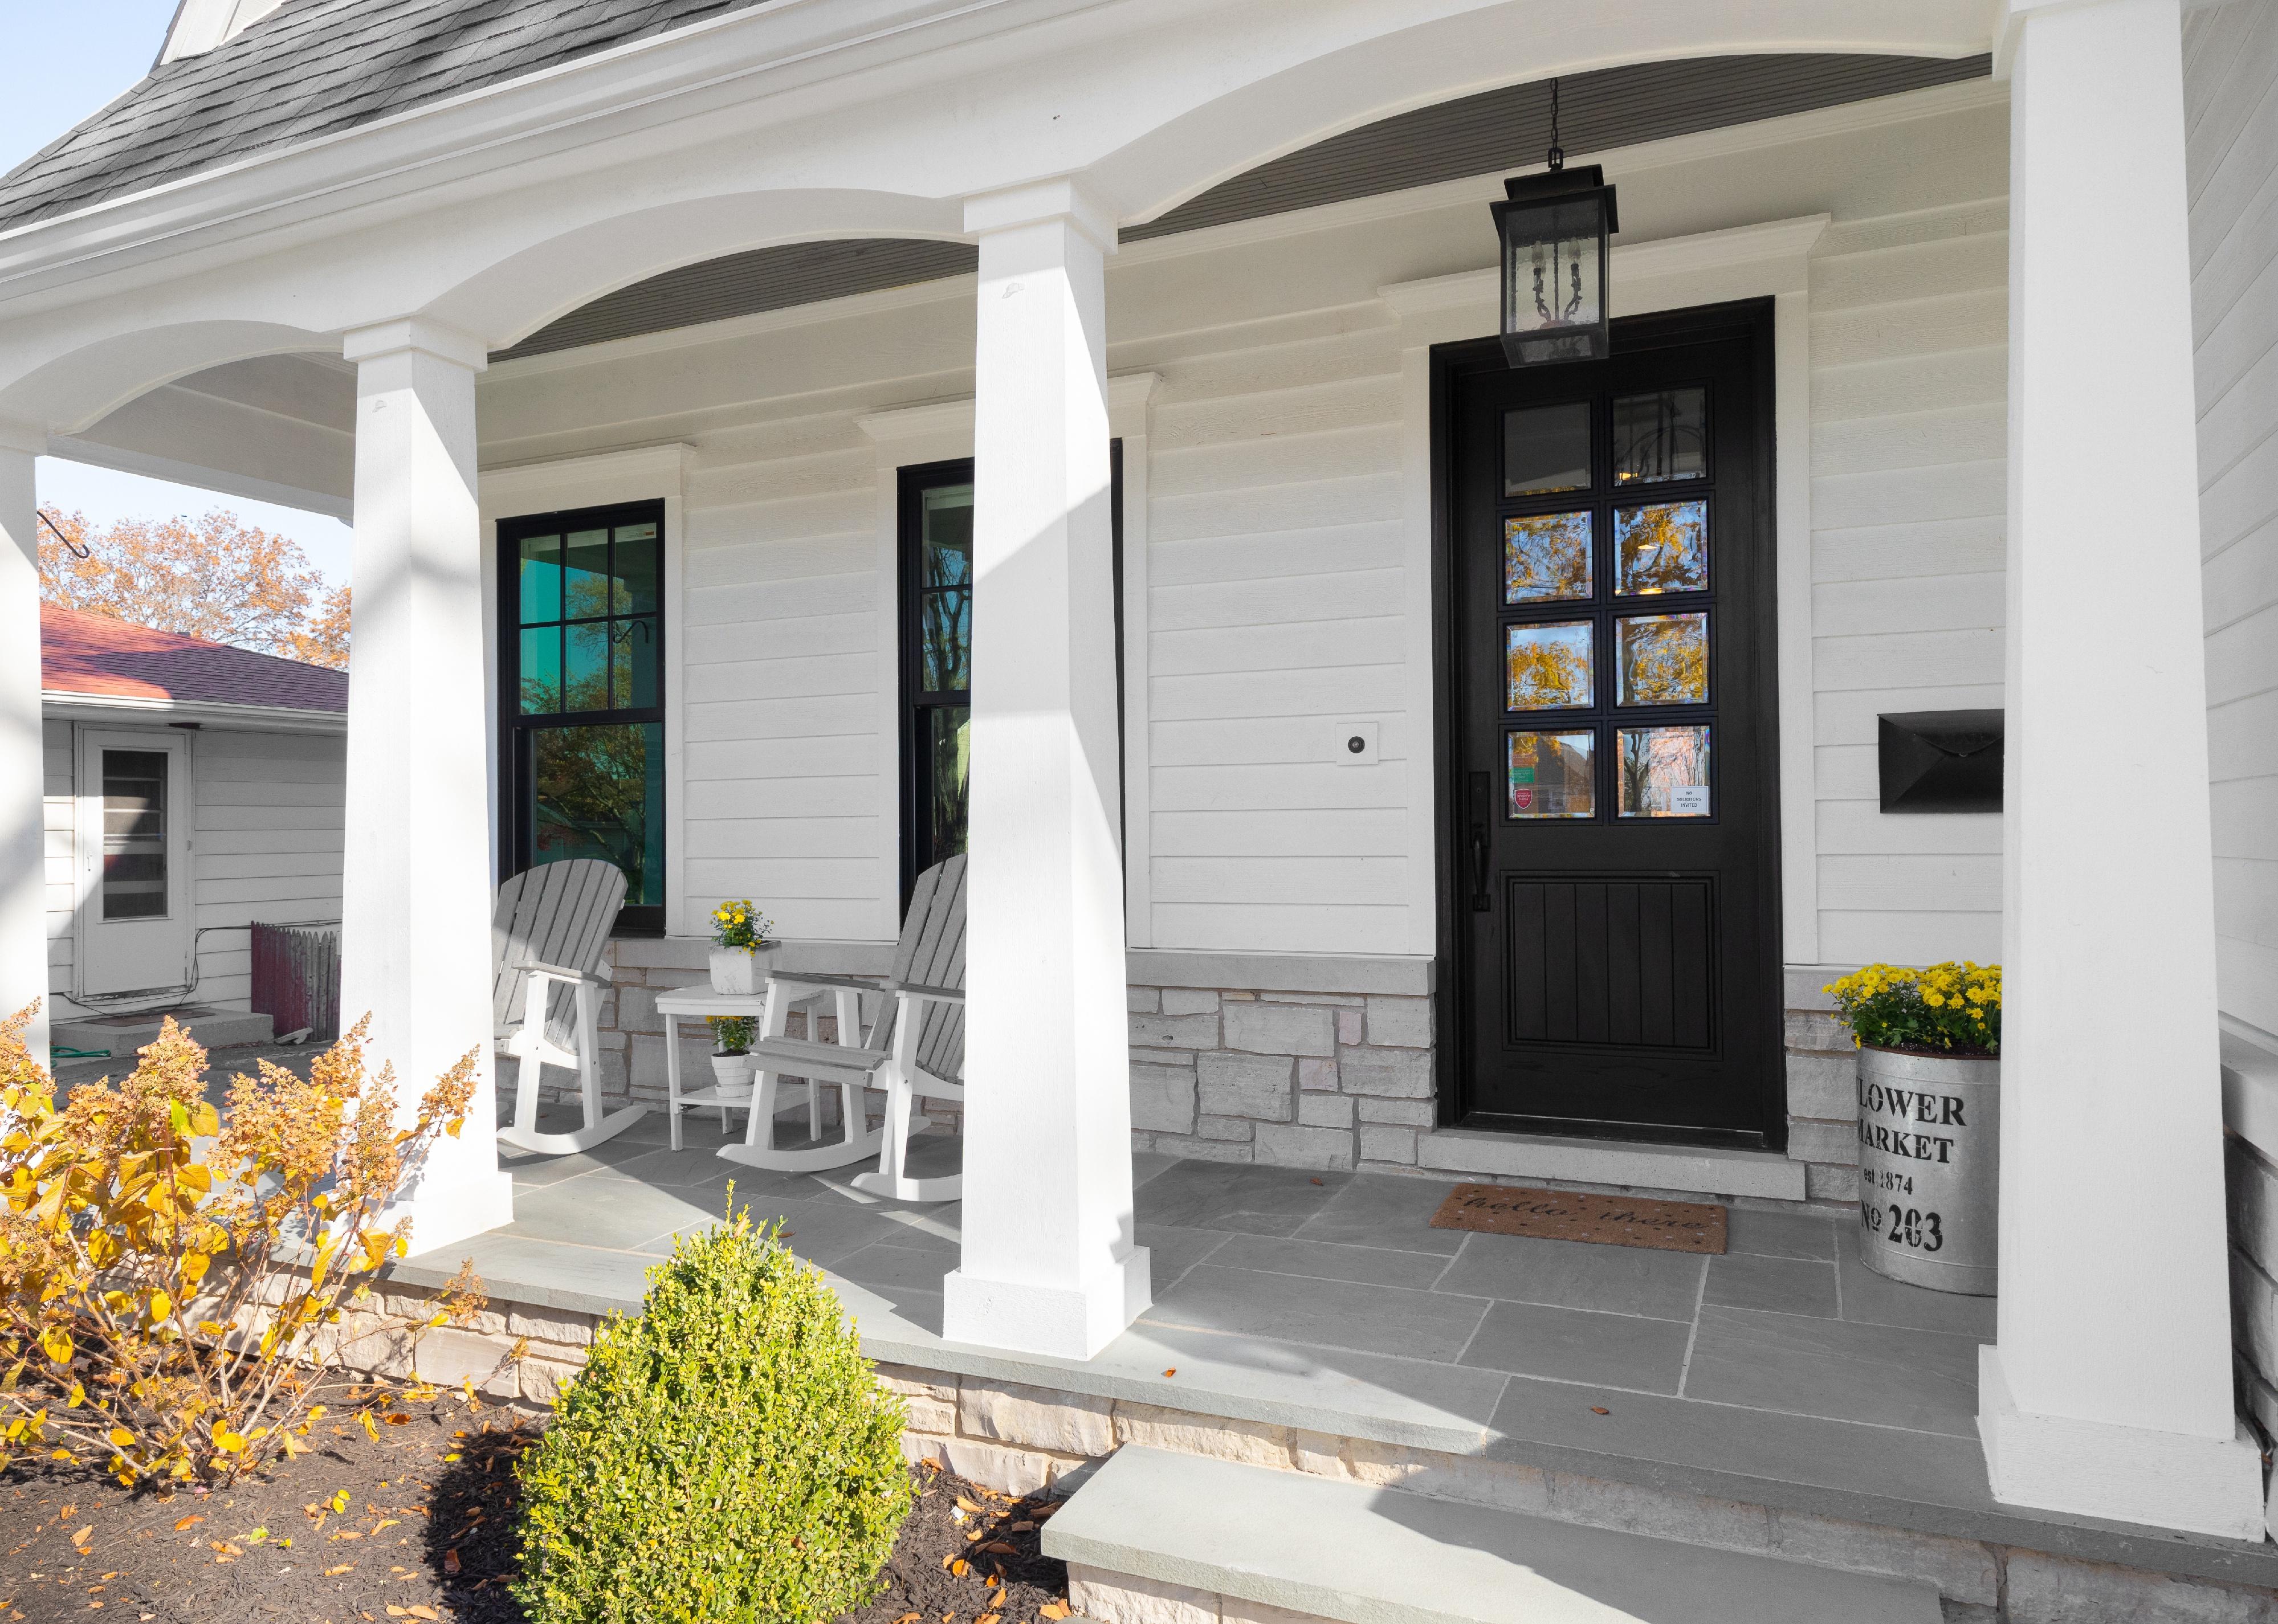
#10. Anchorage, Kentucky
– Population: 2,607
– Median home value: $707,100 (97% own)
– Median rent: $2,031 (3% rent)
– Median household income: $199,261
Anchorage was named in honor of James Goslee, an early resident who was a boat captain on the nearby Ohio River. The 3-square-mile city has a number of historic buildings in its downtown and a range of home designs, including classic Colonial and ranch style, situated on tree-lined blocks.
G. Edward Johnson // Wikimedia Commons
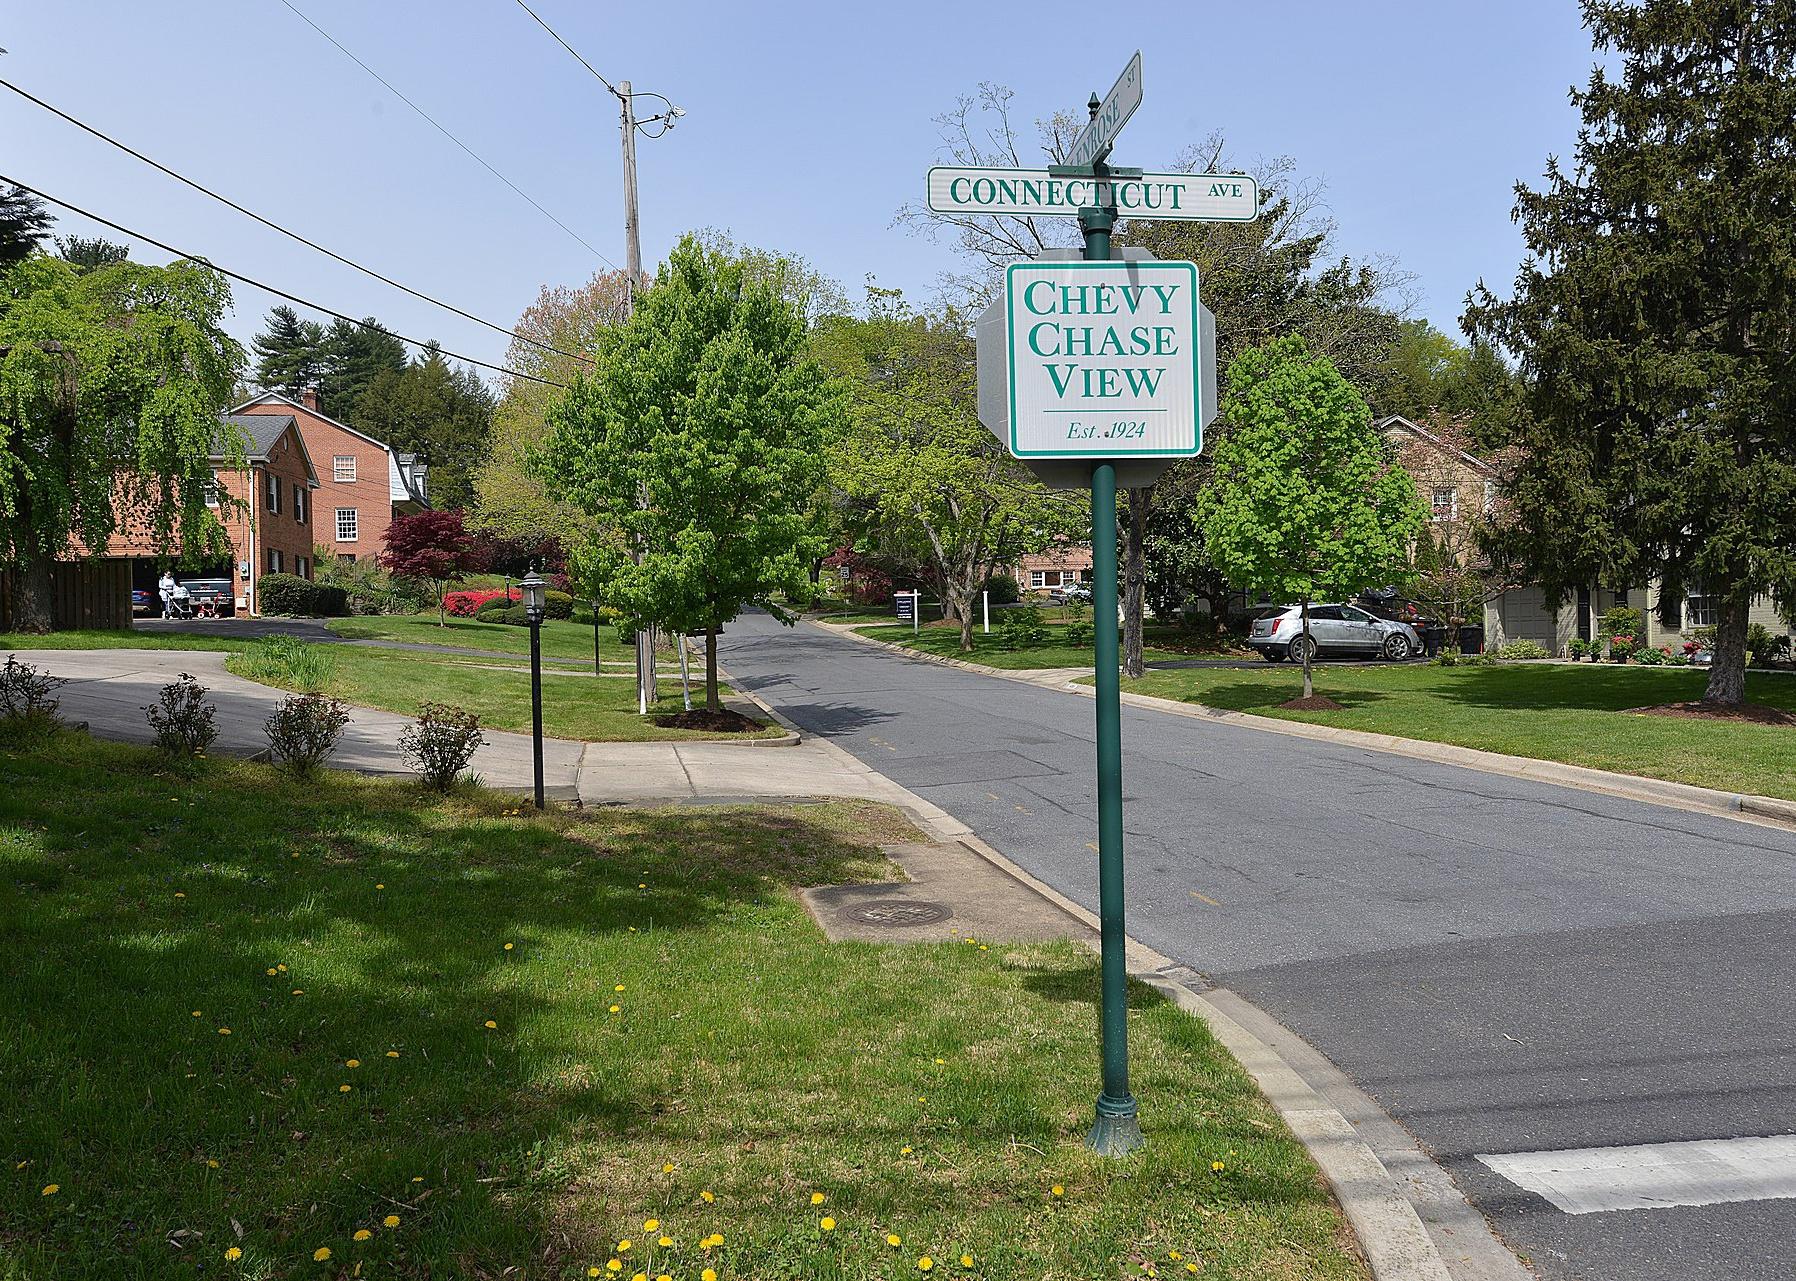
#9. Chevy Chase View, Maryland
– Population: 1,103
– Median home value: $1,003,700 (98% own)
– Median rent: $3,250 (2% rent)
– Median household income: $250,001
Chevy Chase View, an affluent suburb located in the heart of Montgomery County, was incorporated in 1993. It is within walking distance to other posh suburbs in the area. It’s close to the nation’s capital, and therefore home to politicians and other D.C. figures.
TownCreative // Wikimedia Commons
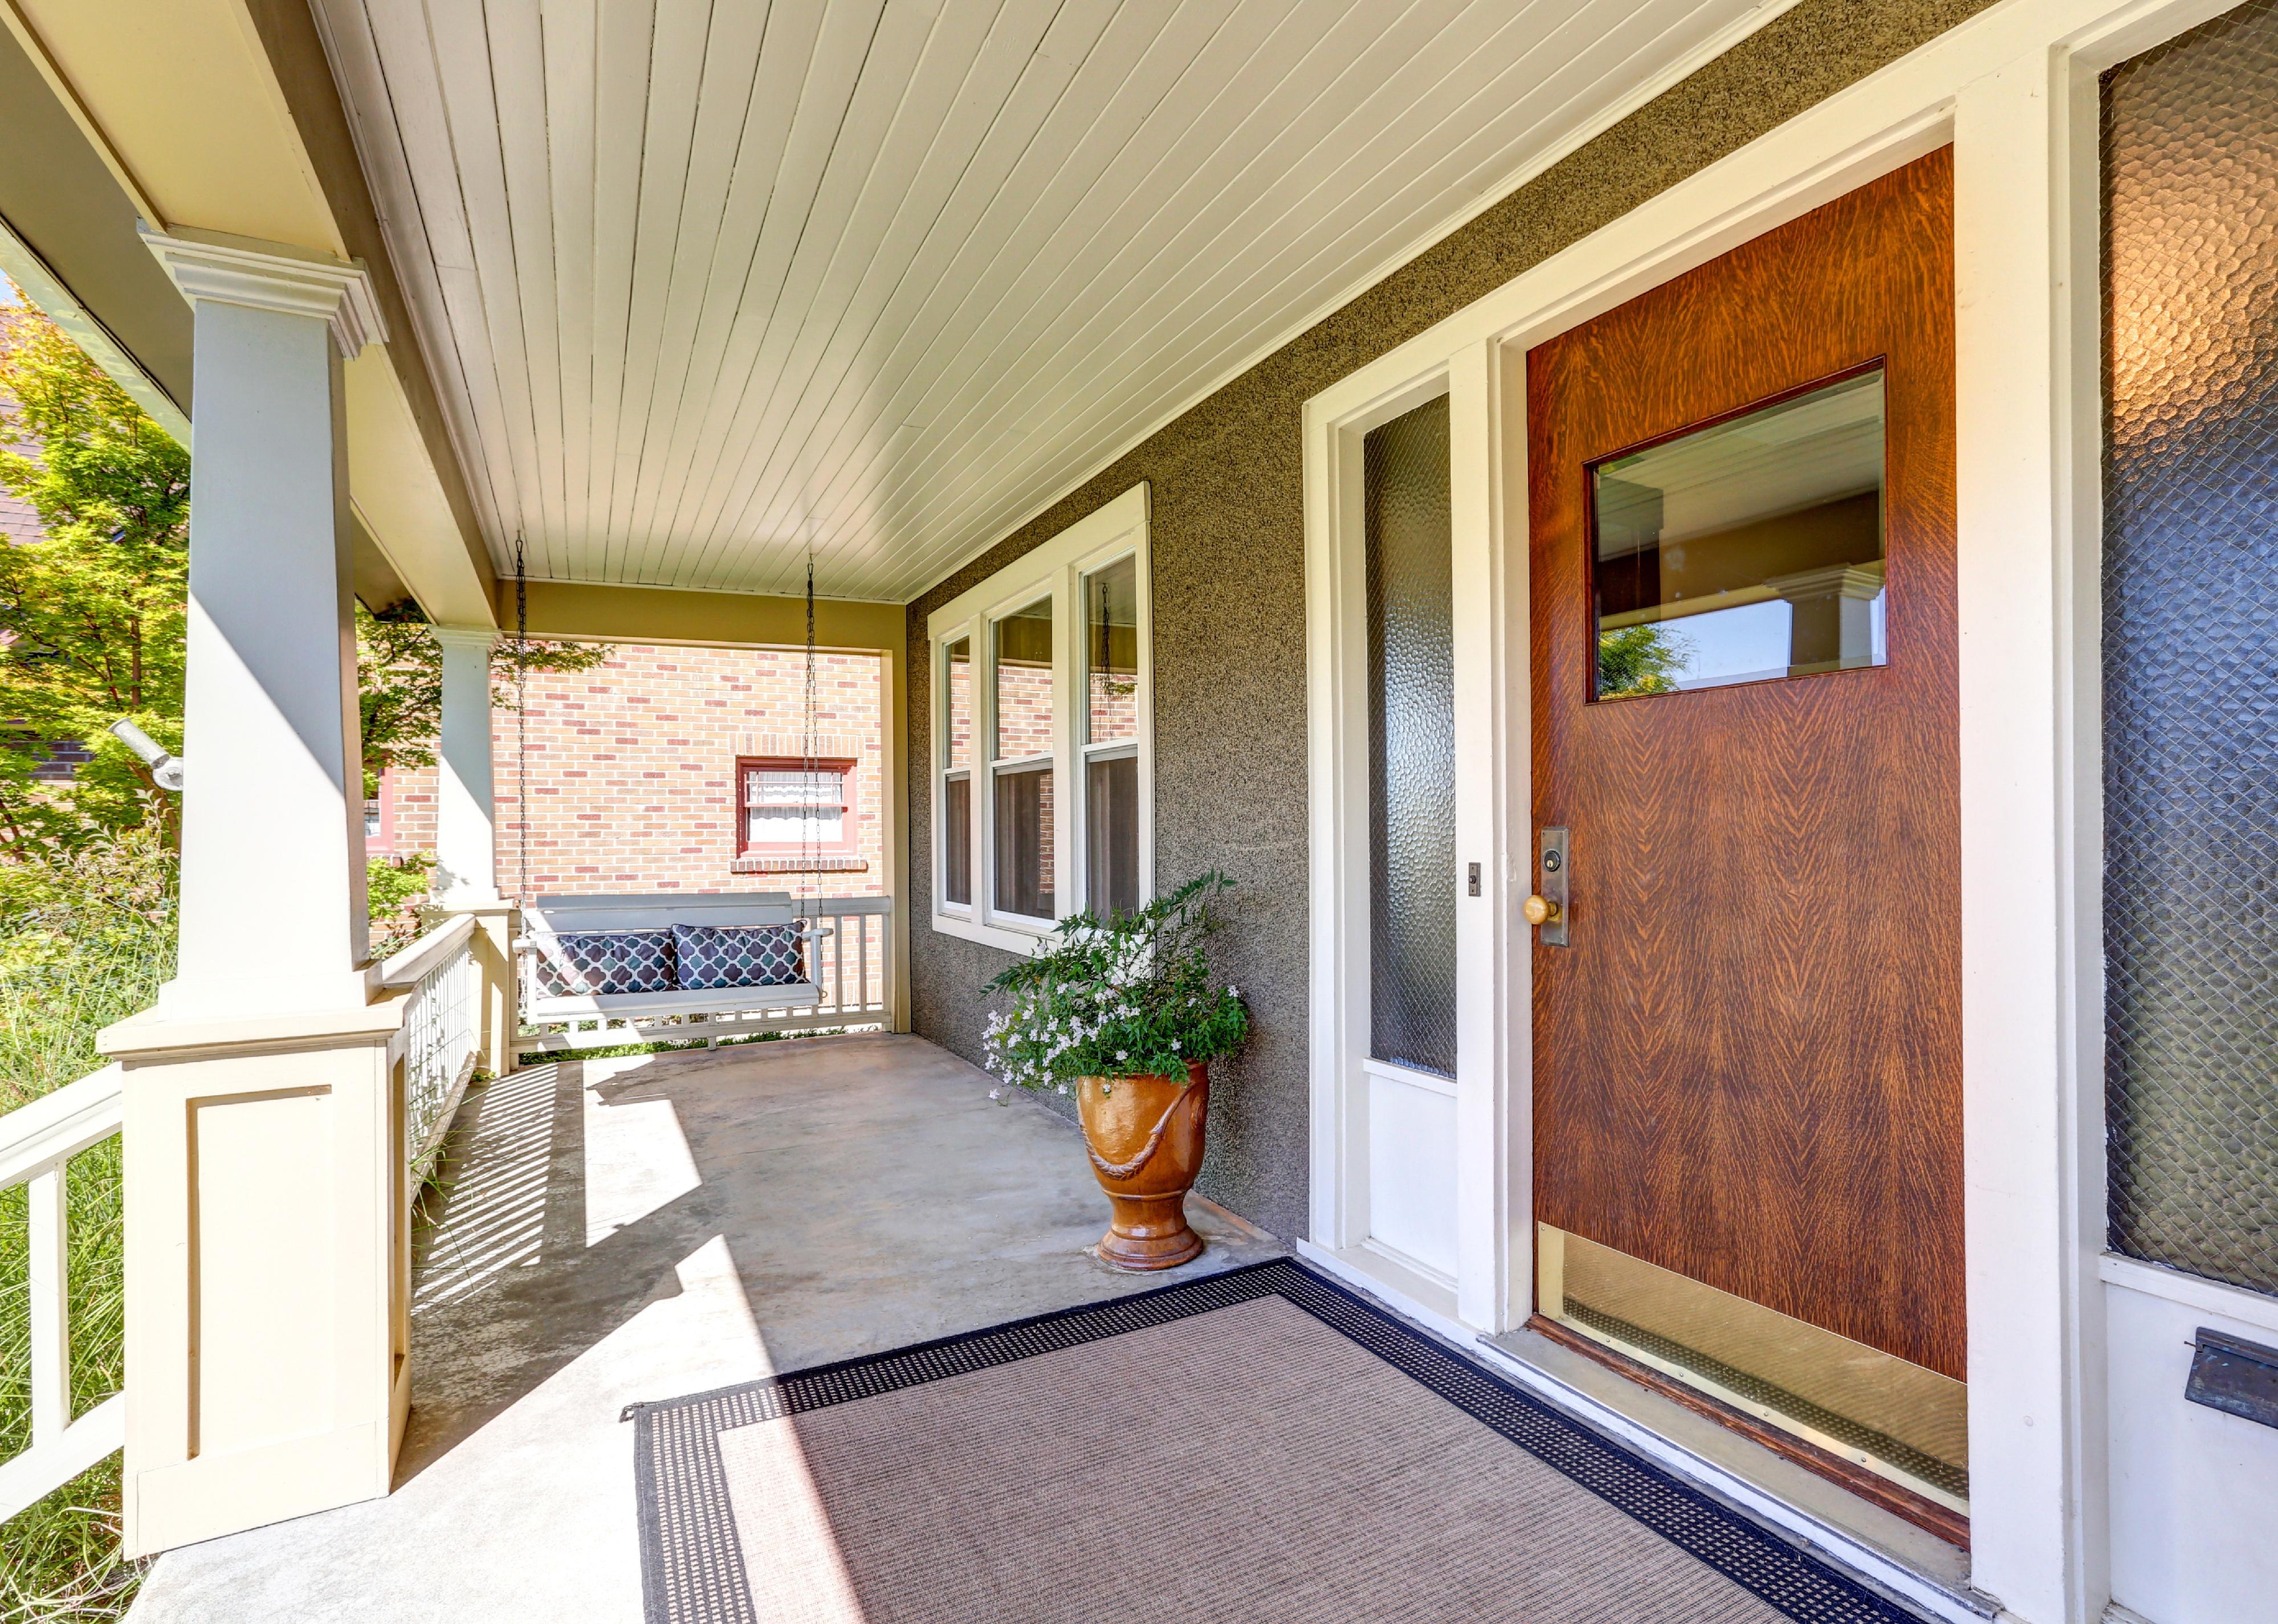
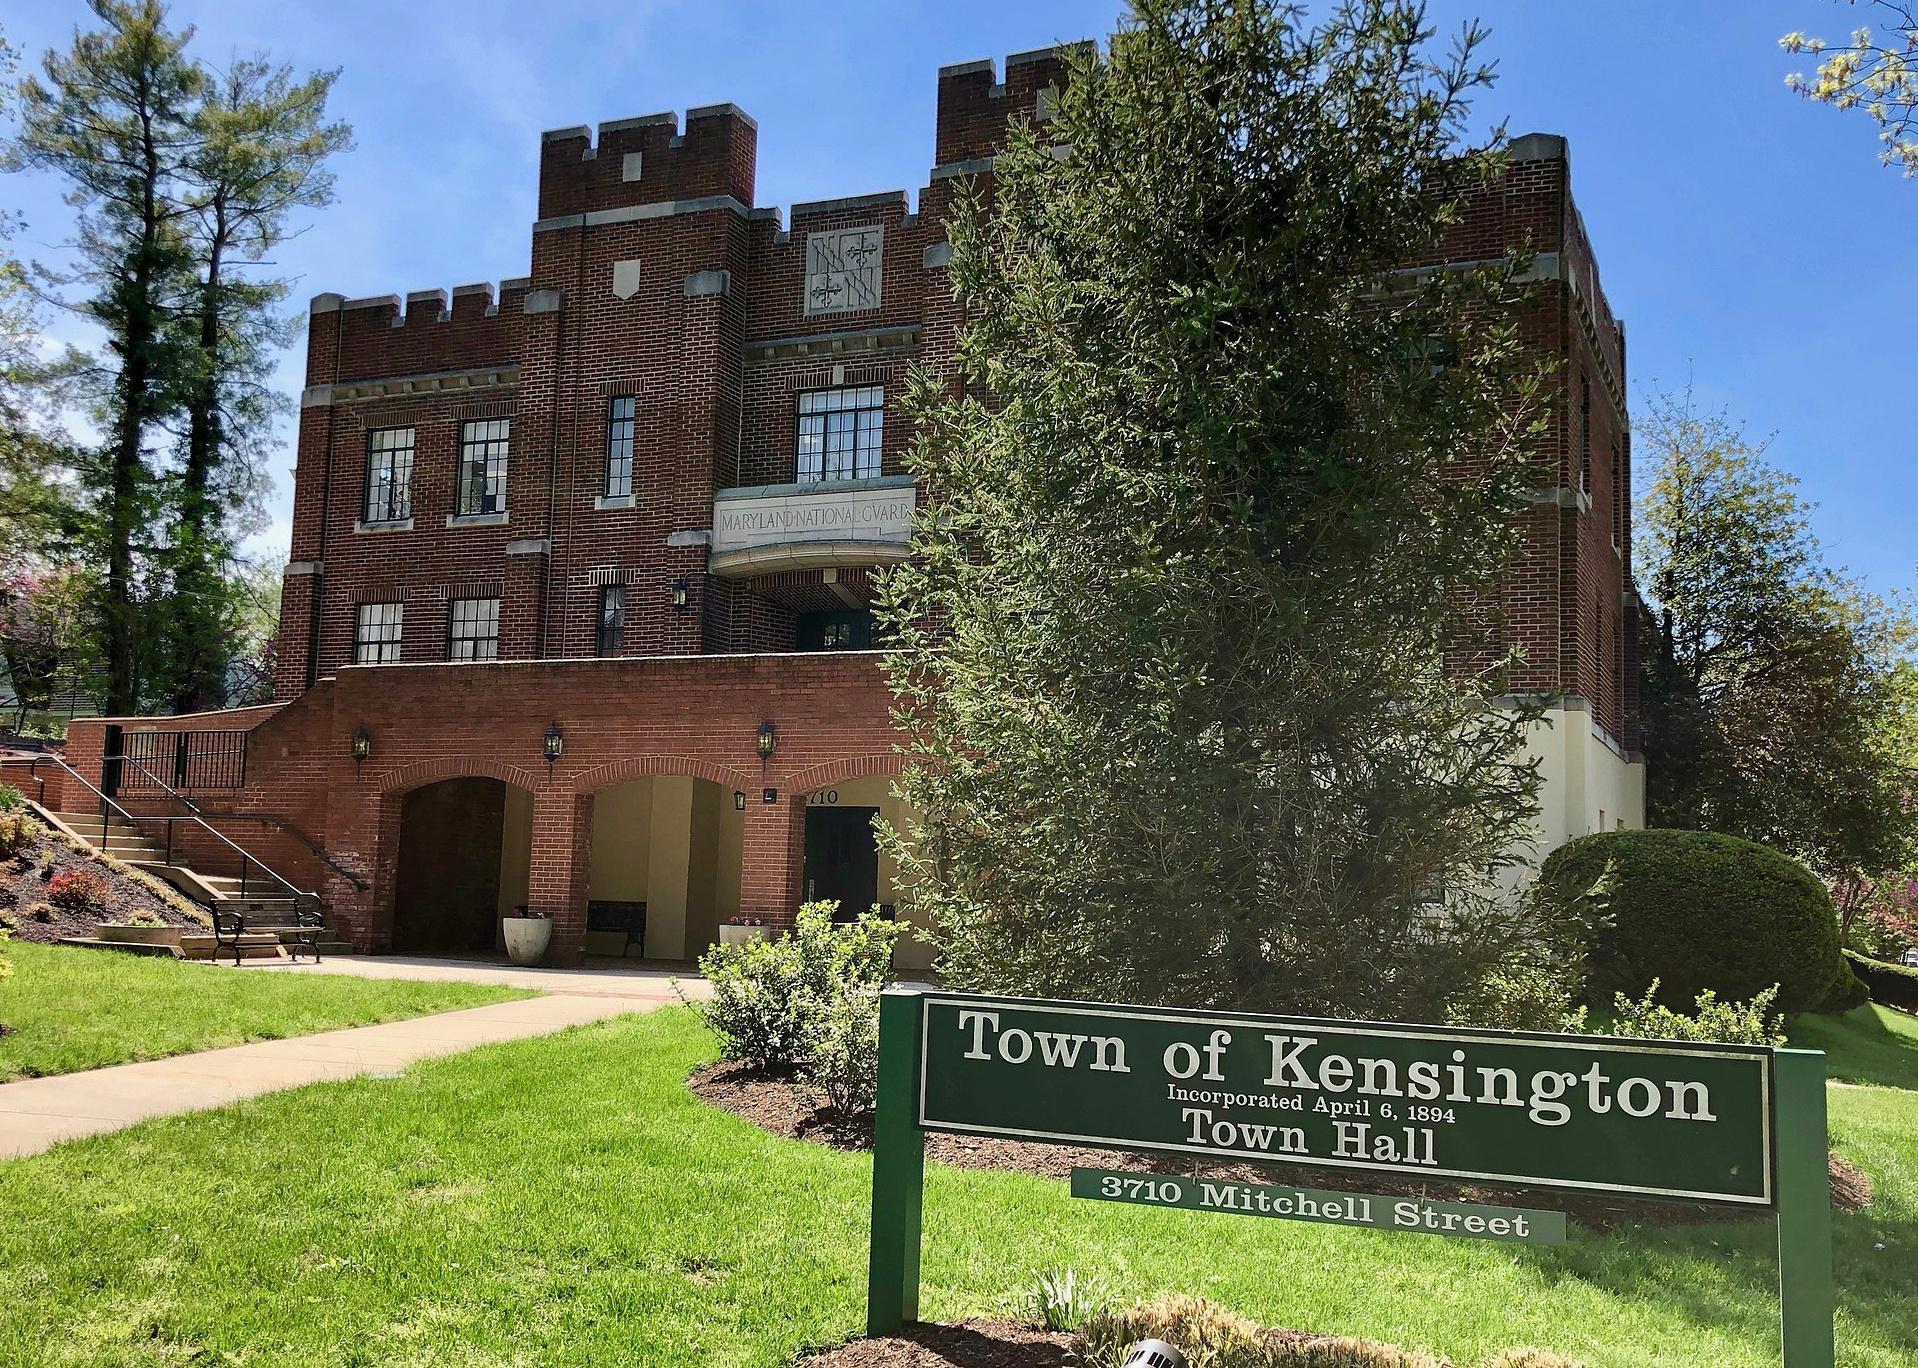
#8. Kensington, Maryland
– Population: 2,336
– Median home value: $797,300 (56% own)
– Median rent: $1,920 (44% rent)
– Median household income: $132,132
Kensington, northwest of Washington D.C., has a small-town vibe with city accessibility, including two nearby Metro stations and a commuter-rail stop in the heart of town. Colonial, ranch, and Tudor-style homes with median values around $750,000 are situated along the community’s tree-lined streets.
LMPark Photos // Shutterstock
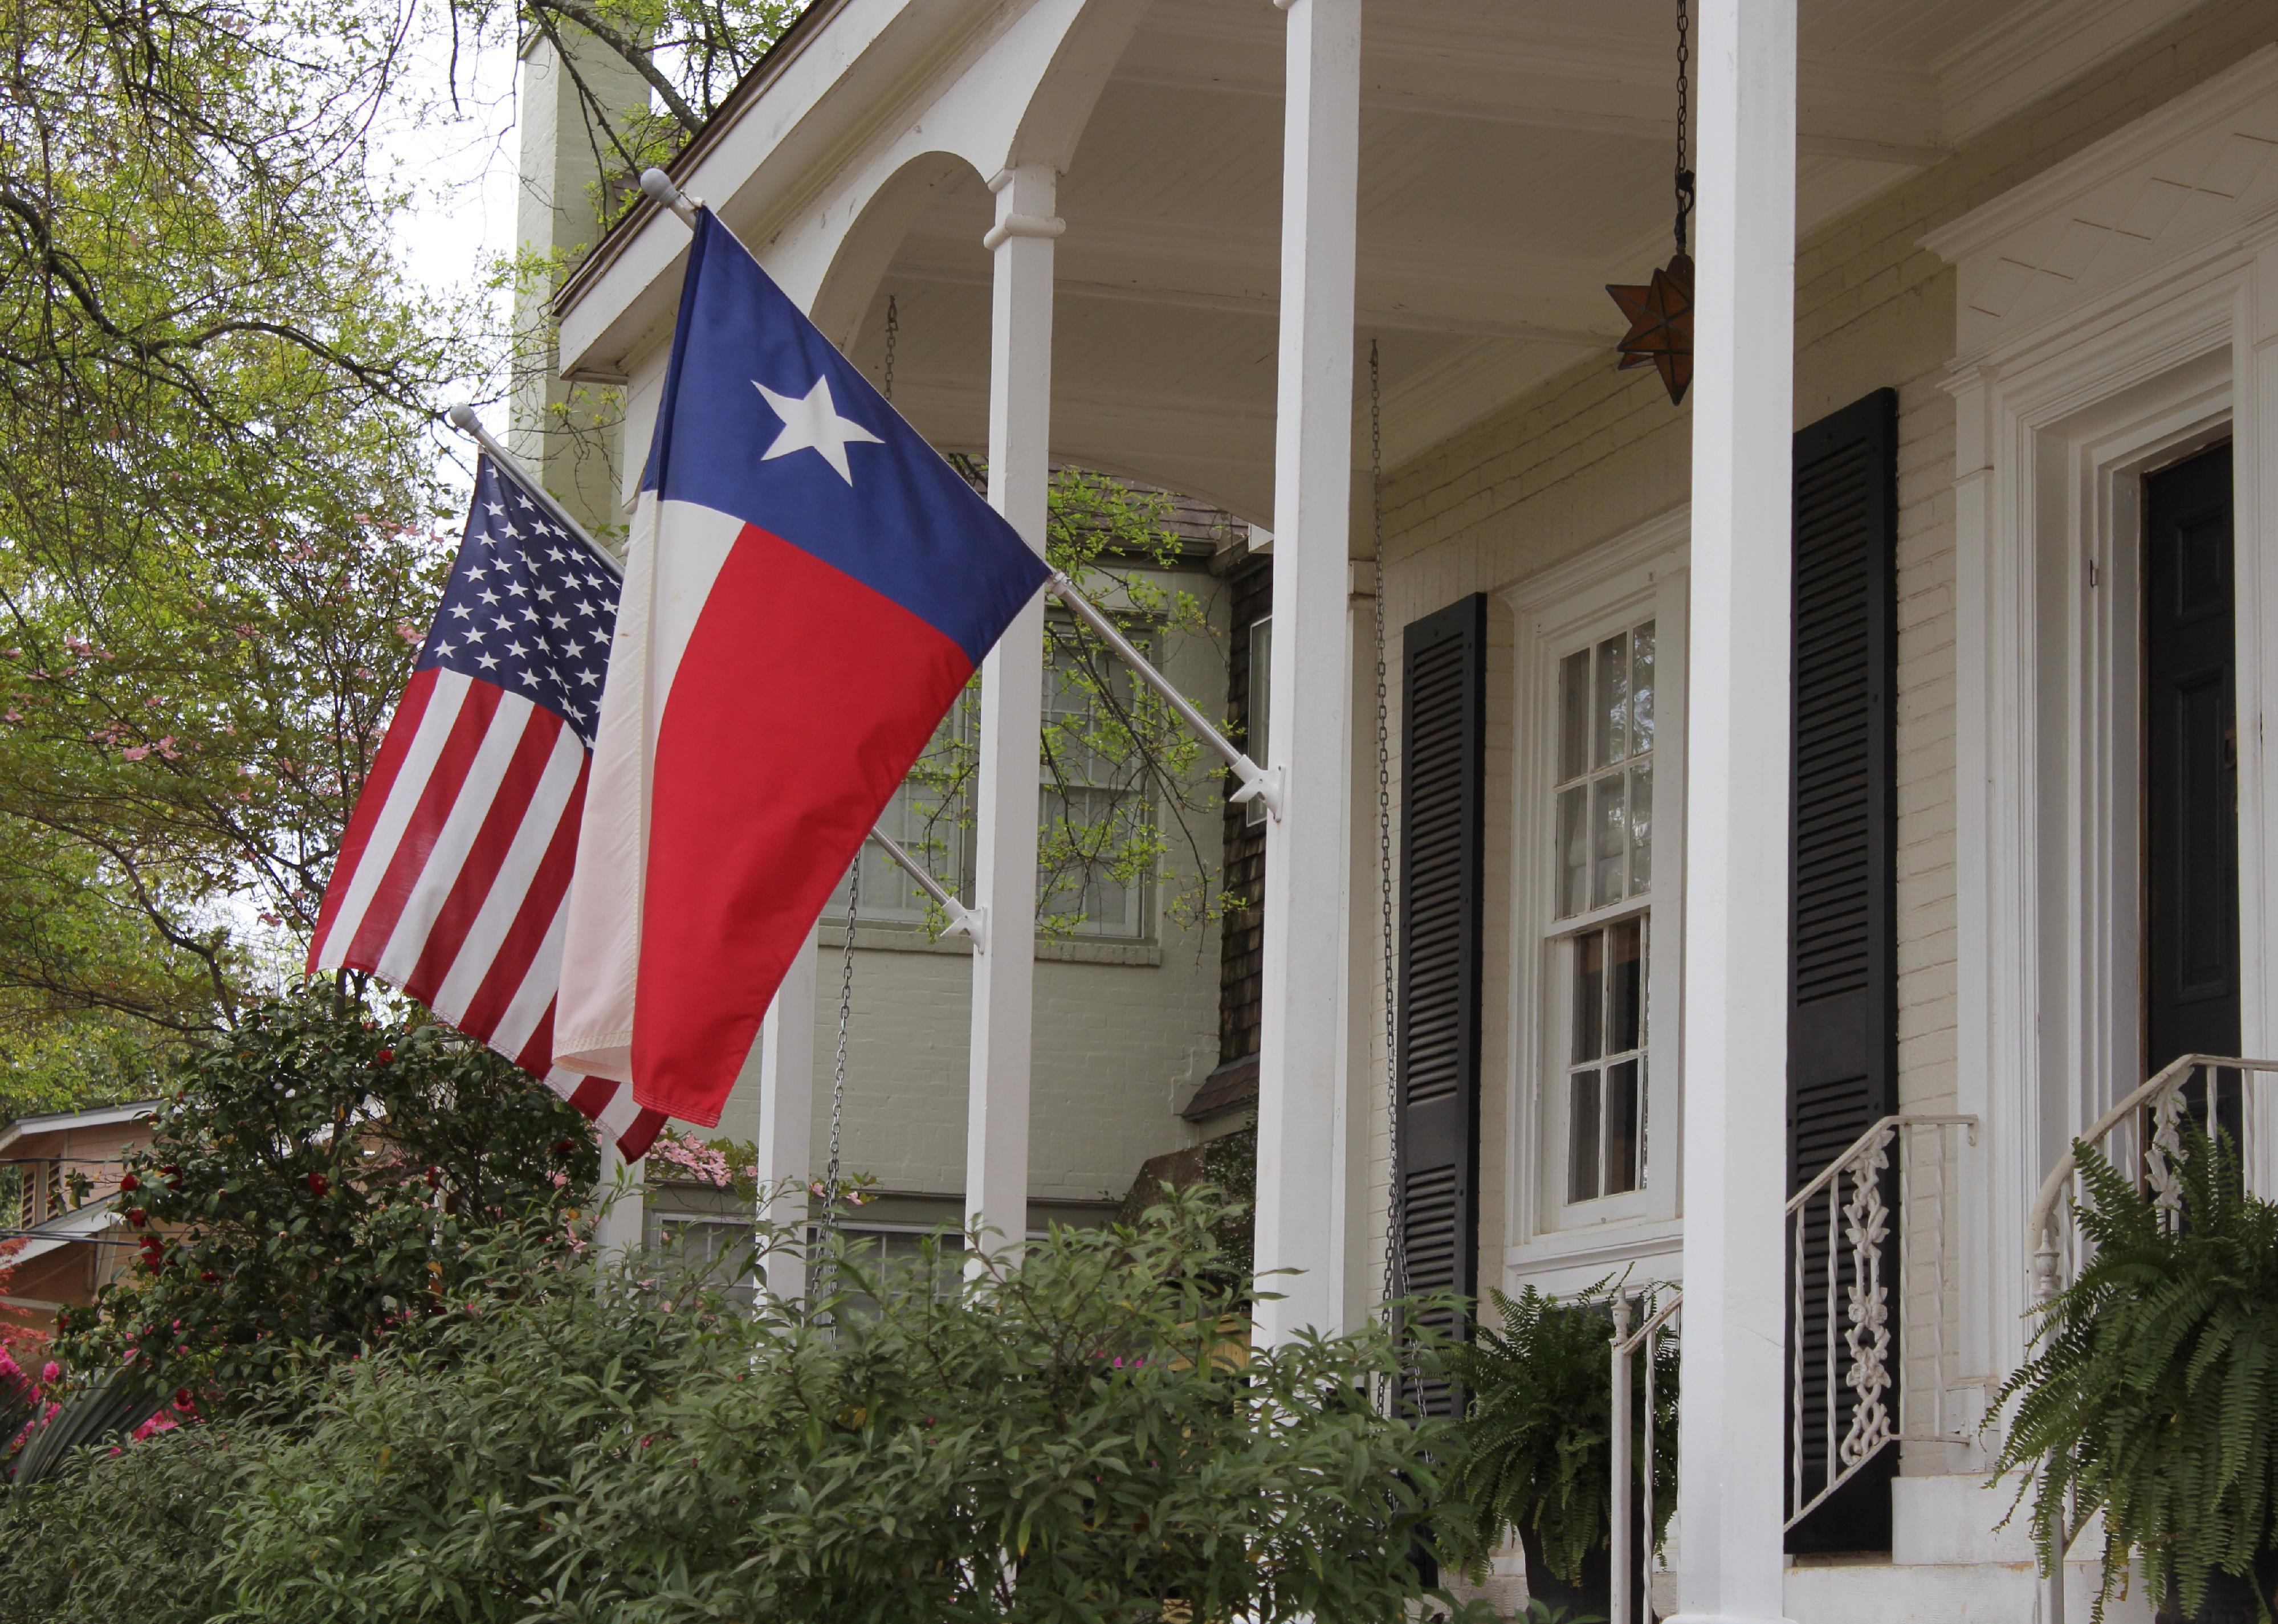
#7. Rollingwood, Texas
– Population: 1,397
– Median home value: $1,306,600 (95% own)
– Median rent: $3,501 (5% rent)
– Median household income: $207,969
Rollingwood, an affluent neighborhood located just outside of Austin, is ideal for those who enjoy outdoor activities. There’s plenty of access to parks and shopping. Visitors can stop by the Austin Nature & Science Center just outside the city limits, which provides educational programs and nature exhibits.

Chris.w.braun // Wikimedia Commons
#6. Shady Hollow, Texas
– Population: 4,587
– Median home value: $469,200 (97% own)
– Median rent: $2,307 (3% rent)
– Median household income: $147,674
Shady Hollow began in 1972 as a 600-acre development by a single company. Six years later, the homeowners claimed the company was building homes more densely than they had promised. In the decades since, the truce between the groups has resulted in an affluent community with many amenities, including parks, a community center, and tennis and basketball courts.
Hendrickson Photography // Wikimedia Commons
#5. Brookmont, Maryland
– Population: 3,841
– Median home value: $1,076,500 (78% own)
– Median rent: $2,650 (22% rent)
– Median household income: $250,001
Brookmont is a neighborhood along the Potomac River just west of Washington D.C., that shares a ZIP Code with neighboring Bethesda. There’s also plenty to do in the nation’s capital, which is just a short drive away.

pics721 // Shutterstock
#4. West Lake Hills, Texas
– Population: 3,373
– Median home value: $1,195,400 (88% own)
– Median rent: $1,365 (12% rent)
– Median household income: $191,667
If you’re into outdoor recreation with scenic views, West Lake Hills may be the ideal place to set roots. This walkable town situated on hilltops offers residents amazing views of downtown Austin and is close to entertainment, dining, and shopping. Many of the residents are professionals who commute to downtown Austin.

AnjelikaGr // Shutterstock
#3. Indian Springs Village, Alabama
– Population: 2,563
– Median home value: $433,100 (96% own)
– Median rent: No data available (4% rent)
– Median household income: $124,659
Indian Springs Village, a residential neighborhood just minutes away from downtown Birmingham, provides quality schools and a tight-knit community. Most of the residents have good jobs and own their homes. However, Indian Springs Village, intent on keeping its peaceful small-town vibe, doesn’t have a public transit system.

Thomson200 // Wikimedia Commons
#2. Berkeley Lake, Georgia
– Population: 2,503
– Median home value: $557,000 (97% own)
– Median rent: $2,154 (3% rent)
– Median household income: $138,182
The city of Berkeley Lake, first developed in 1948, surrounds its namesake lake, which is formed by one of the largest dams in all of Georgia. The area was a summer retreat with fishing cottages nestled among permanent residences for several years. These days, this distant northern suburb of Atlanta is home to large numbers of college-educated professionals, most of whom own their homes. With good schools, it’s an ideal location for families to settle.

pim pic // Shutterstock
#1. Spring Valley Village, Texas
– Population: 4,204
– Median home value: $940,600 (97% own)
– Median rent: $2,455 (3% rent)
– Median household income: $224,722
Spring Valley, a suburb of Houston, was incorporated in 1955. At that time, homes were only allowed to be one story tall. It wasn’t until 1981 that two-story homes were permitted. That’s an example of how intent the community is on retaining its rural character, an effort reinforced in 2007 when the city officially changed its name from Spring Valley to Spring Valley Village.

In today’s digital climate, consuming sports has never been easier. Thanks to a plethora of streaming sites, alternative broadcasts, and advancements to home entertainment systems, the average fan has myriad options to watch and learn about their favorite teams at the touch of a button—all without ever having to leave the couch.
As a result, more and more sports venues have committed to improving and modernizing their facilities and fan experiences to compete with at-home audiences. Consider using mobile ticketing and parking passes, self-service kiosks for entry and ordering food, enhanced video boards, and jumbotrons that supply data analytics and high-definition replays. These innovations and upgrades are meant to draw more revenue and attract various sponsored partners. They also deliver unique and convenient in-person experiences that rival and outmatch traditional ways of enjoying games.
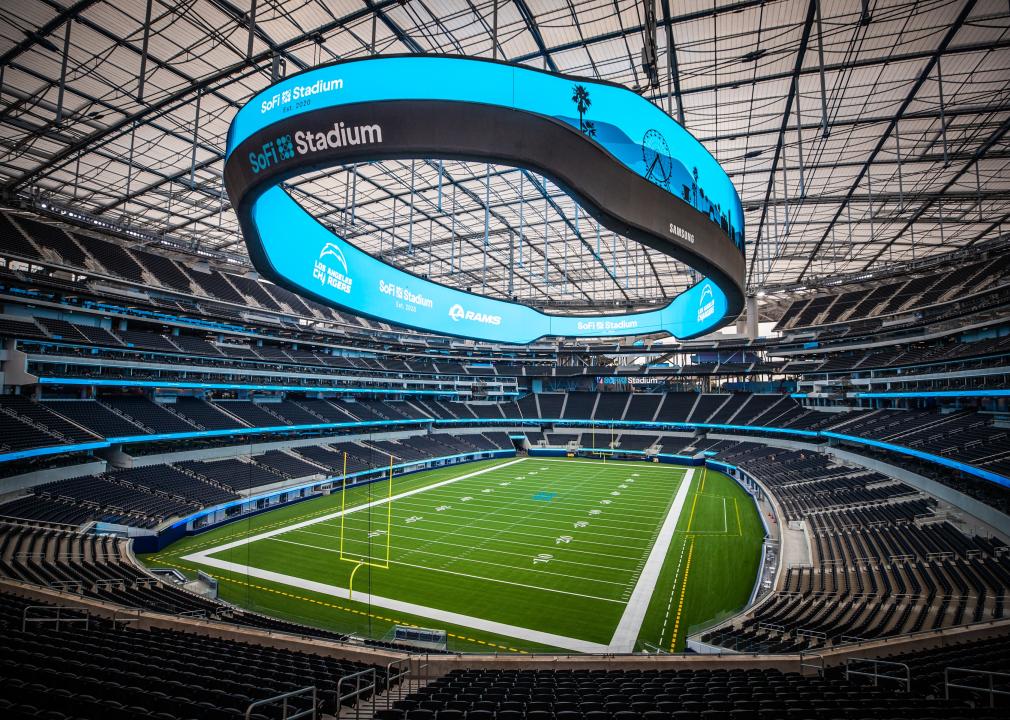
In Los Angeles, the Rams and Chargers’ SoFi Stadium has become the gold standard for football venues. It’s an architectural wonder with closer views, enhanced hospitality, and a translucent roof that cools the stadium’s internal temperature.
The Texas Rangers’ ballpark, Globe Life Field, added field-level suites and lounges that resemble the look and feel of a sports bar. Meanwhile, the Los Angeles Clippers are building a new arena (in addition to retail space, team offices, and an outdoor public plaza) that will seat 18,000 people and feature a fan section called The Wall, which will regulate attire and rooting interest.
It’s no longer acceptable to operate with old-school facilities and technology. Just look at Commanders Field (formerly FedExField), home of the Washington Commanders, which has faced criticism for its faulty barriers, leaking ceilings, poor food options, and long lines. Understandably, the team has been attempting to find a new location to build a state-of-the-art stadium and keep up with the demand for high-end amenities.
As more organizations audit their stadiums and arenas and keep up with technological innovations, Uniqode compiled a list of the latest tech advancements to coax—and keep—fans inside venues.
![]()
Jeff Gritchen/MediaNews Group/Orange County Register // Getty Images
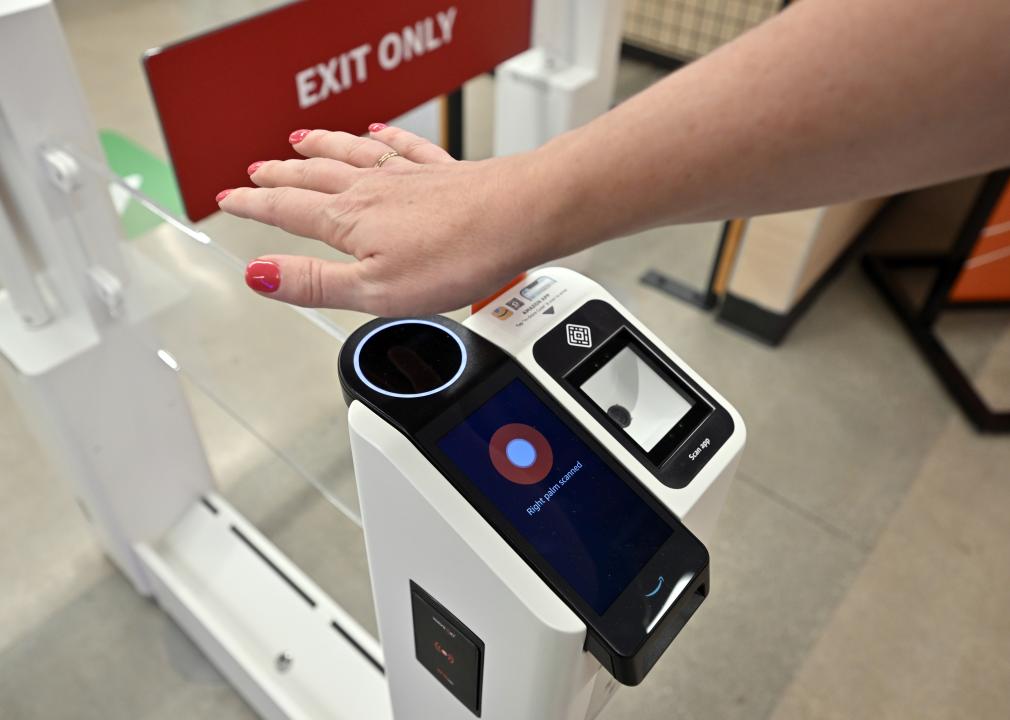
Just Walk Out technology
After successfully installing its first cashierless grocery store in 2020, Amazon has continued to put its tracking technology into practice.
In 2023, the Seahawks incorporated Just Walk Out technology at various merchandise stores throughout Lumen Field, allowing fans to purchase items with a swipe and scan of their palms.
The radio-frequency identification system, which involves overhead cameras and computer vision, is a substitute for cashiers and eliminates long lines.
RFID is now found in a handful of stadiums and arenas nationwide. These stores have already curbed checkout wait times, eliminated theft, and freed up workers to assist shoppers, according to Jon Jenkins, vice president of Just Walk Out tech.

Billie Weiss/Boston Red Sox // Getty Images
Self-serve kiosks
In the same vein as Amazon’s self-scanning technology, self-serve kiosks have become a more integrated part of professional stadiums and arenas over the last few years. Some of these function as top-tier vending machines with canned beers and nonalcoholic drinks, shuffling lines quicker with virtual bartenders capable of spinning cocktails and mixed drinks.
The kiosks extend past beverages, as many college and professional venues have started using them to scan printed and digital tickets for more efficient entrance. It’s an effort to cut down lines and limit the more tedious aspects of in-person attendance, and it’s led various competing kiosk brands to provide their specific conveniences.

Kyle Rivas // Getty Images
Mobile ordering
Is there anything worse than navigating the concourse for food and alcohol and subsequently missing a go-ahead home run, clutch double play, or diving catch?
Within the last few years, more stadiums have eliminated those worries thanks to contactless mobile ordering. Fans can select food and drink items online on their phones to be delivered right to their seats. Nearly half of consumers said mobile app ordering would influence them to make more restaurant purchases, according to a 2020 study at PYMNTS. Another study showed a 22% increase in order size.
Many venues, including Yankee Stadium, have taken notice and now offer personalized deliveries in certain sections and established mobile order pick-up zones throughout the ballpark.

Darrian Traynor // Getty Images
QR codes at seats
Need to remember a player’s name? Want to look up an opponent’s statistics at halftime? The team at Digital Seat Media has you covered.
Thus far, the company has added seat tags to more than 50 venues—including two NFL stadiums—with QR codes to promote more engagement with the product on the field. After scanning the code, fans can access augmented reality features, look up rosters and scores, participate in sponsorship integrations, and answer fan polls on the mobile platform.

Boris Streubel/Getty Images for DFL // Getty Images
Real-time data analytics and generative AI
As more venues look to reinvigorate the in-stadium experience, some have started using generative artificial intelligence and real-time data analytics. Though not used widely yet, generative AI tools can create new content—text, imagery, or music—in conjunction with the game, providing updates, instant replays, and location-based dining suggestions
Last year, the Masters golf tournament even began including AI score projections in its mobile app. Real-time data is streamlining various stadium pitfalls, allowing operation managers to monitor staffing issues at busy food spots, adjust parking flows, and alert custodians to dirty or damaged bathrooms. The data also helps with security measures. Open up an app at a venue like the Honda Center in Anaheim, California, and report safety issues or belligerent fans to help better target disruptions and preserve an enjoyable experience.
Story editing by Nicole Caldwell. Copy editing by Paris Close. Photo selection by Lacy Kerrick.
This story originally appeared on Uniqode and was produced and
distributed in partnership with Stacker Studio.

Inflation has cooled substantially, but Americans are still feeling the strain of sky-high prices. Consumers have to spend more on the same products, from the grocery store to the gas pump, than ever before.
Increased import costs are part of the problem. The U.S. is the largest goods importer in the world, bringing in $3.2 trillion in 2022. Import costs rose dramatically in 2021 and 2022 due to shipping constraints, world events, and other supply chain interruptions and cost pressures. At the June 2022 peak, import costs for all commodities were up 18.6% compared to January 2020.
While import costs have since fallen most months—helping to lower inflation—they remain nearly 12% above what they were in 2020. And beginning in 2024, import costs began to rise again, with January seeing the highest one-month increase since March 2022.
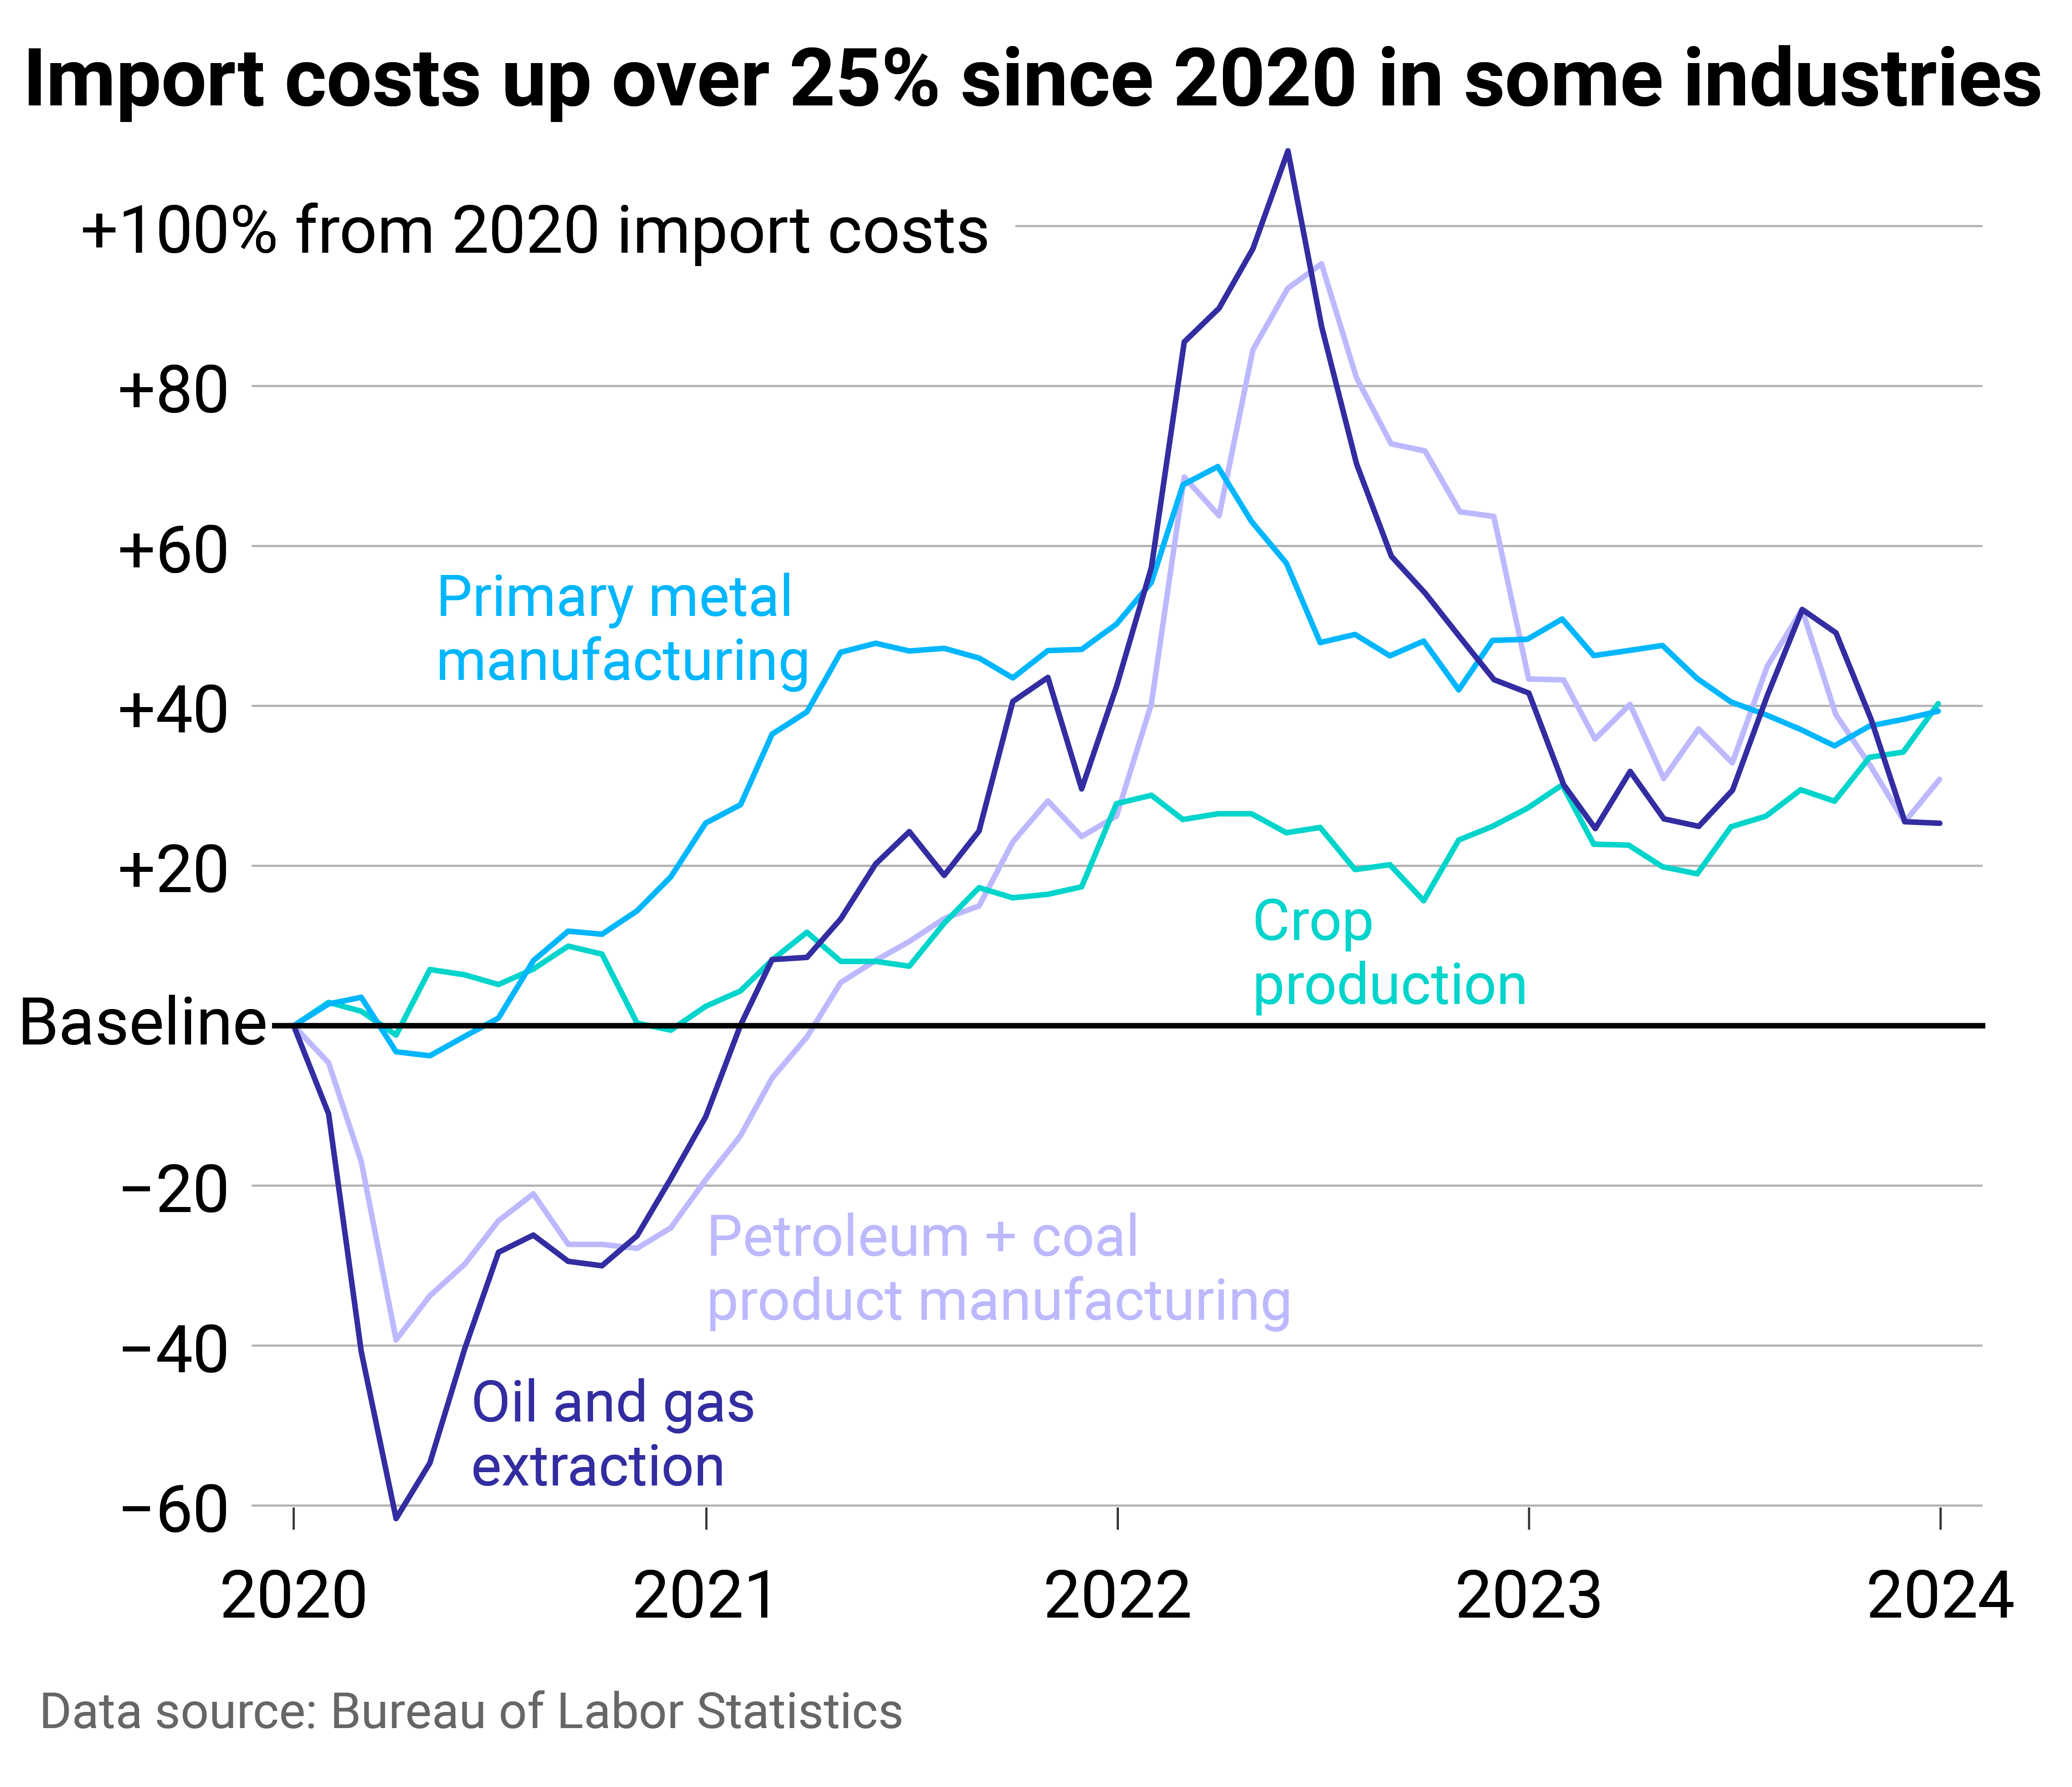
Machinery Partner used Bureau of Labor Statistics data to identify the soaring import costs that have translated to higher costs for Americans. Imports in a few industries have had an outsized impact, helping drive some of the overall spikes. Crop production, primary metal manufacturing, petroleum and coal product manufacturing, and oil and gas extraction were the worst offenders, with costs for each industry remaining at least 20% above 2020.
![]()
Machinery Partner
Imports related to crops, oil, and metals are keeping costs up
At the mid-2022 peak, import costs related to oil, gas, petroleum, and coal products had the highest increases, doubling their pre-pandemic costs. Oil prices went up globally as leaders anticipated supply disruptions from the conflict in Ukraine. The U.S. and other allied countries put limits on Russian revenues from oil sales through a price cap of oil, gas, and coal from the country, which was enacted in 2022.
This activity around the world’s second-largest oil producer pushed prices up throughout the market and intensified fluctuations in crude oil prices. Previously, the U.S. had imported hundreds of thousands of oil barrels from Russia per day, making the country a leading source of U.S. oil. In turn, the ban affected costs in the U.S. beyond what occurred in the global economy.
Americans felt this at the pump—with gasoline prices surging 60% for consumers year-over-year in June 2022 and remaining elevated to this day—but also throughout the economy, as the entire supply chain has dealt with higher gas, oil, and coal prices.
Some of the pressure from petroleum and oil has shifted to new industries: crop production and primary metal manufacturing. In each of these sectors, import costs in January were up about 40% from 2020.
Primary metal manufacturing experienced record import price growth in 2021, which continued into early 2022. The subsequent monthly and yearly drops have not been substantial enough to bring costs down to pre-COVID levels. Bureau of Labor Statistics reporting shows that increasing alumina and aluminum production prices had the most significant influence on primary metal import prices. Aluminum is widely used in consumer products, from cars and parts to canned beverages, which in turn inflated rapidly.
Aluminum was in short supply in early 2022 after high energy costs—i.e., gas—led to production cuts in Europe, driving aluminum prices to a 13-year high. The U.S. also imposes tariffs on aluminum imports, which were implemented in 2018 to cut down on overcapacity and promote U.S. aluminum production. Suppliers, including Canada, Mexico, and European Union countries, have exemptions, but the tax still adds cost to imports.
U.S. agricultural imports have expanded in recent decades, with most products coming from Canada, Mexico, the EU, and South America. Common agricultural imports include fruits and vegetables—especially those that are tropical or out-of-season—as well as nuts, coffee, spices, and beverages. Turmoil with Russia was again a large contributor to cost increases in agricultural trade, alongside extreme weather events and disruptions in the supply chain. Americans felt these price hikes directly at the grocery store.
The U.S. imports significantly more than it exports, and added costs to those imports are felt far beyond its ports. If import prices continue to rise, overall inflation would likely follow, pushing already high prices even further for American consumers.
Story editing by Shannon Luders-Manuel. Copy editing by Kristen Wegrzyn.
This story originally appeared on Machinery Partner and was produced and
distributed in partnership with Stacker Studio.

Nearly every state requires drivers to carry car insurance, but the laws vary, and many factors affect the cost of coverage.
Some are controllable, at least to degrees: the type of car you have and your credit history. Some are not: your age and gender. Your marital status, place of residence, and claims history are among the other variables that go into it.
Across the United States, premiums are soaring, rising 20% year over year and increasing six times faster than consumer prices overall as of December 2023, CBS reported. Last September, CNN noted that car insurance rates jumped more in the previous year than they had since 1976.
CBS pointed to many potential reasons for these increases in prices. Coronavirus pandemic-era issues have made buying, fixing, and replacing vehicles costlier. Extreme weather events caused by climate change also damage more vehicles, while insurance companies are increasing their business costs. Severe and more frequent crashes are to blame as well, CNN reported.
On top of these, local factors such as population density, the number of uninsured drivers, and the frequency of insurance claims all affect premiums, which can lead motorists to change or switch their coverage, use other modes of transportation, or even alter decisions about when to buy a vehicle or what to look for.
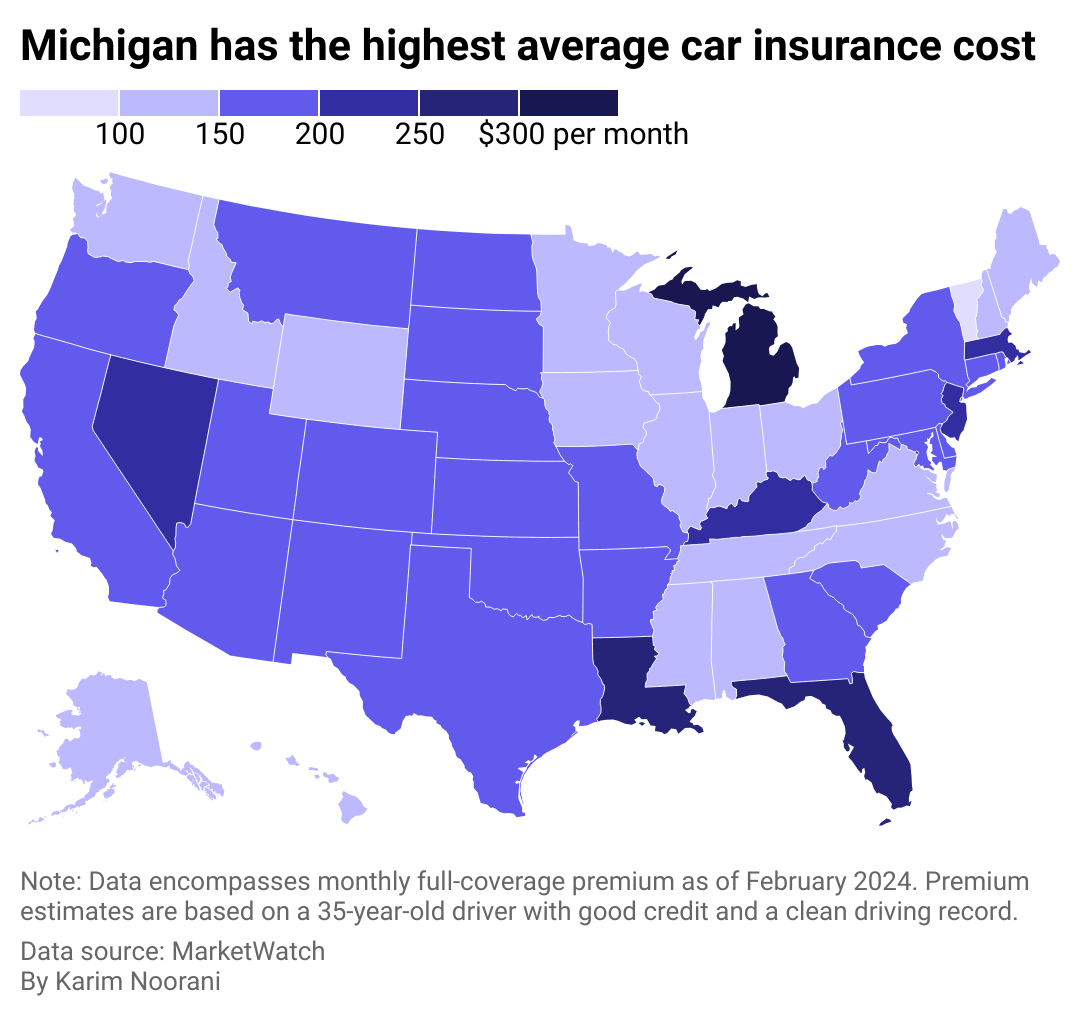
To see how geography affects cost, Cheap Insurance mapped the states where people pay the most in car insurance premiums using MarketWatch data. Premium estimates were based on full-coverage car insurance for a 35-year-old driver with good credit and a clean driving record. Data accurate as of February 2024.
![]()
Cheap Insurance
Americans pay $167 per month on average for full-coverage insurance
There are common denominators among the five states where it’s most expensive to have car insurance: Michigan, Florida, Louisiana, Nevada, and Kentucky. Washington D.C. is another pricey locale, ranking #4 overall.
Three of these six are no-fault jurisdictions and require additional coverage beyond coverage to pay for medical costs. Michigan notably calls for $250,000 in personal injury protection (though people with Medicaid and Medicare may qualify for lower limits), $1 million in personal property insurance for damage done by your car in Michigan, and residual bodily injury and property damage liability that starts at $250,000 for a person harmed in an accident.
Other commonalities between these states include high urban population densities. At least 9 in 10 people in Nevada, Florida, and Washington D.C. live in cities and urban areas, which leads to more crashes and thefts and high rates of uninsured drivers and lawsuits. Additionally, Louisiana, Florida, and Kentucky rank #5, #8, and #10, respectively, in motor vehicle crash deaths per 100 million vehicle miles traveled in 2021 based on Department of Transportation data analyzed by the Insurance Institute for Highway Safety.

Canva
#5. Kentucky
– Monthly full-coverage insurance: $210
– Monthly liability insurance: $57

Canva
#4. Nevada
– Monthly full-coverage insurance: $232
– Monthly liability insurance: $107
Canva
#3. Louisiana
– Monthly full-coverage insurance: $253
– Monthly liability insurance: $77

Canva
#2. Florida
– Monthly full-coverage insurance: $270
– Monthly liability insurance: $115

Canva
#1. Michigan
– Monthly full-coverage insurance: $304
– Monthly liability insurance: $113
Story editing by Carren Jao. Copy editing by Paris Close. Photo selection by Lacy Kerrick.
This story originally appeared on Cheap Insurance and was produced and
distributed in partnership with Stacker Studio.
-

 Business4 months ago
mesh conference goes deep on AI, with experts focusing in on training, ethics, and risk
-

 Business4 months ago
Skill-based hiring is the answer to labour shortages, BCG report finds
-

 Events6 months ago
Top 5 tech and digital transformation events to wrap up 2023
-

 People4 months ago
How connected technologies trim rework and boost worker safety in hands-on industries
-

 Events3 months ago
The Northern Lights Technology & Innovation Forum comes to Calgary next month