
Business
What types of commercial buildings consume the most energy?
Running a business isn’t just a time-consuming venture: It can eat up a huge amount of energy as well. Commercial buildings account for an estimated 18% of total U.S. energy consumption, costing around $190 billion annually. These buildings house industries including health care, food services, retail, education, worship services, public safety, and more.
Although personal residences have more flexibility to lower comfort to save money—think turning down the thermostat even in those cold winter months to save on your heating bill— commercial facilities are often expected to provide amenities to customers continuously, no matter the cost. This can include electricity-intensive air conditioning, heating, refrigeration, and lighting.
Electricity and gas are the main energy sources for commercial buildings, with electricity making up 60% of energy consumed, while natural gas accounts for 34%. Buildings over 100,000 square feet make up just 2% of commercial buildings in the U.S. but account for over one-third of total energy consumed across all commercial facilities, according to a Commercial Buildings Energy Consumption Survey released in 2022.
Using data from the Energy Information Administration, LED Lighting Supply identified commercial buildings by their principal use to determine which consume the most energy. The data is from 2018 and was released in December 2022.
The uses include space heating, cooling, ventilation, water heating, lighting, cooking, refrigeration, office equipment, and computing. It is important to note that although some uses have the highest overall energy use due to their prevalence within a certain industry, they do not necessarily have the highest per-building energy use.
![]()
Mark Winfrey // Shutterstock
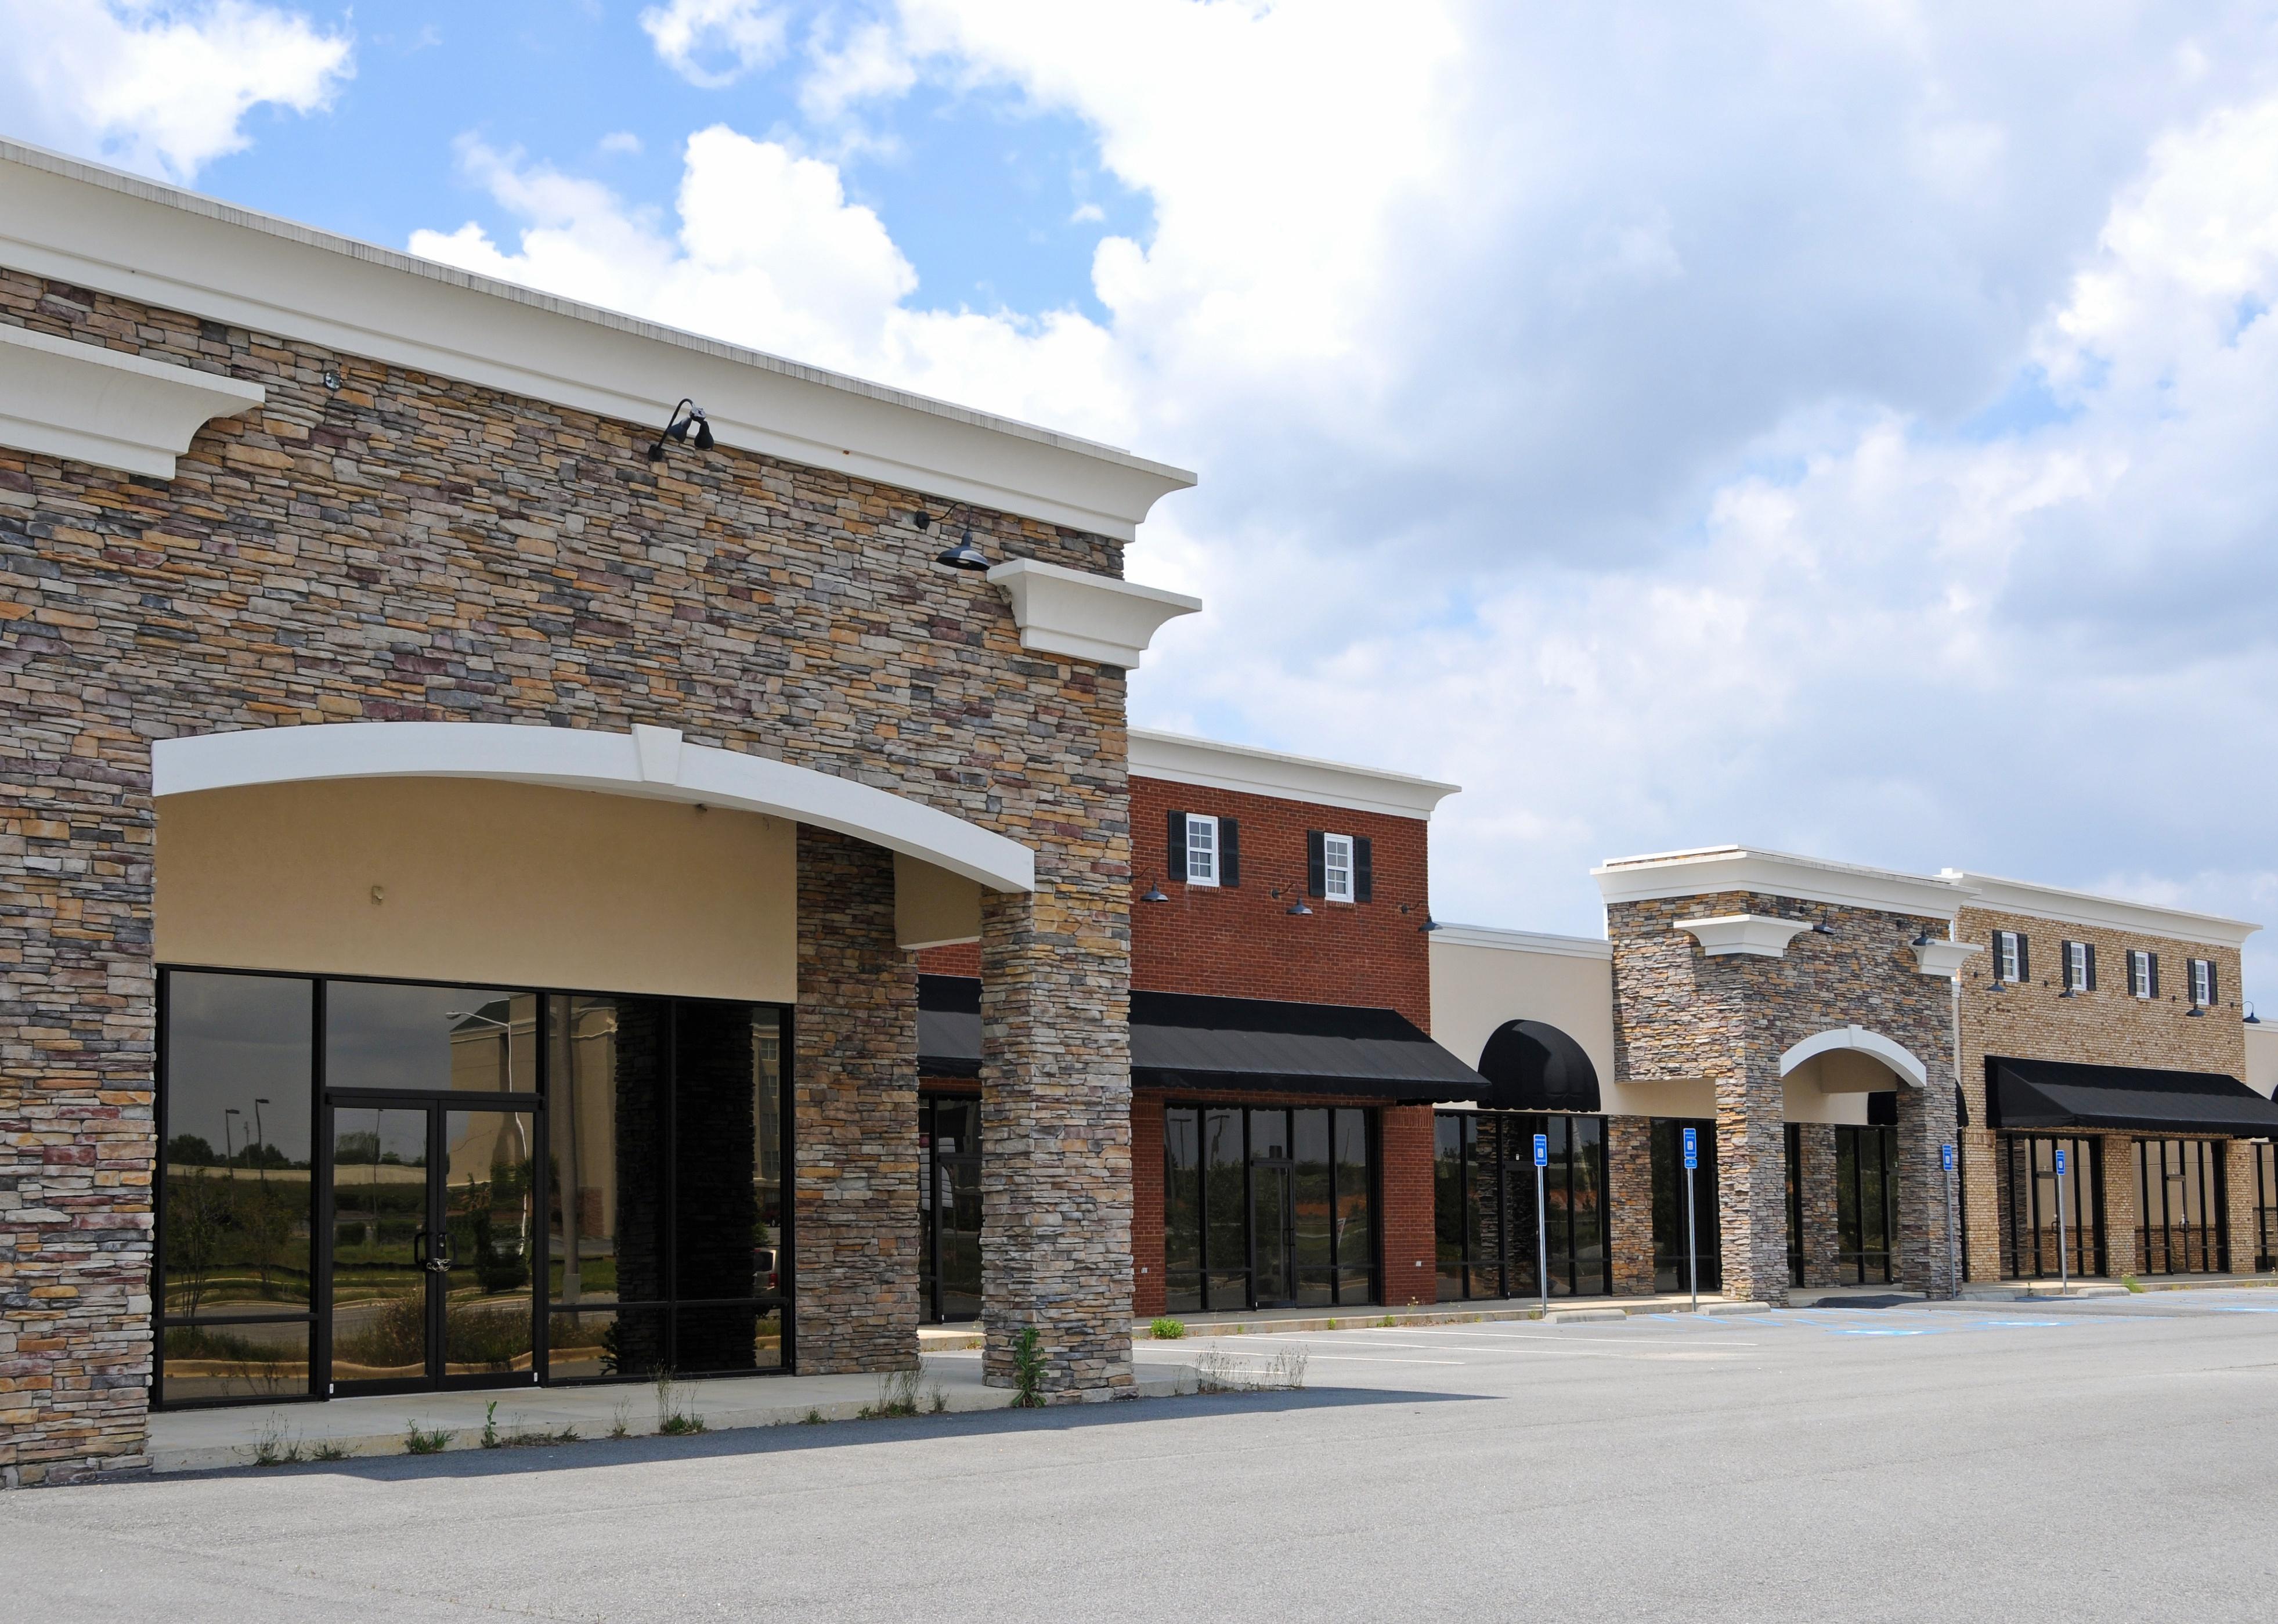
#13. Vacant buildings
– Annual energy use for vacant buildings: 5B kilowatt-hours (39K kilowatt-hours per building)
Even vacant buildings use a considerable amount of energy, often from keeping systems running that are necessary to keep the building functional. Around 40% of a vacant building’s energy output is used to heat the space, another 20% for cooling, and 10% for lighting. During the height of the COVID-19 pandemic, when virtually all office buildings were left empty, many companies found that their leases legally bound them to keep heating, cooling, and other systems operating for a certain minimum of hours.

Wangkun Jia // Shutterstock
#12. Public order and safety
– Annual energy use for public order and safety: 21B kilowatt-hours (263K kilowatt-hours per building)
— Fire or police station: 7B kilowatt-hours (122K kilowatt-hours per building)
— Courthouse or probation office: 5B kilowatt-hours (595K kilowatt-hours per building)
— Other public order: 9B kilowatt-hours (794K kilowatt-hours per building)
Around 35% of energy in a public order building is directed towards heating, and a further 10% each towards cooling, water heating, and lighting. In fire stations specifically, the kitchen, gym, laundry, and other appliances are used more than in a typical household, serving the round-the-clock staff that spends time there on-call. Apparatus bays where firetrucks are housed also require a substantial amount of heating. In police stations, telephone lines, computer networks, HVAC systems, and other electricity-powered systems are also kept running for extended hours.
Sean Pavone // Shutterstock
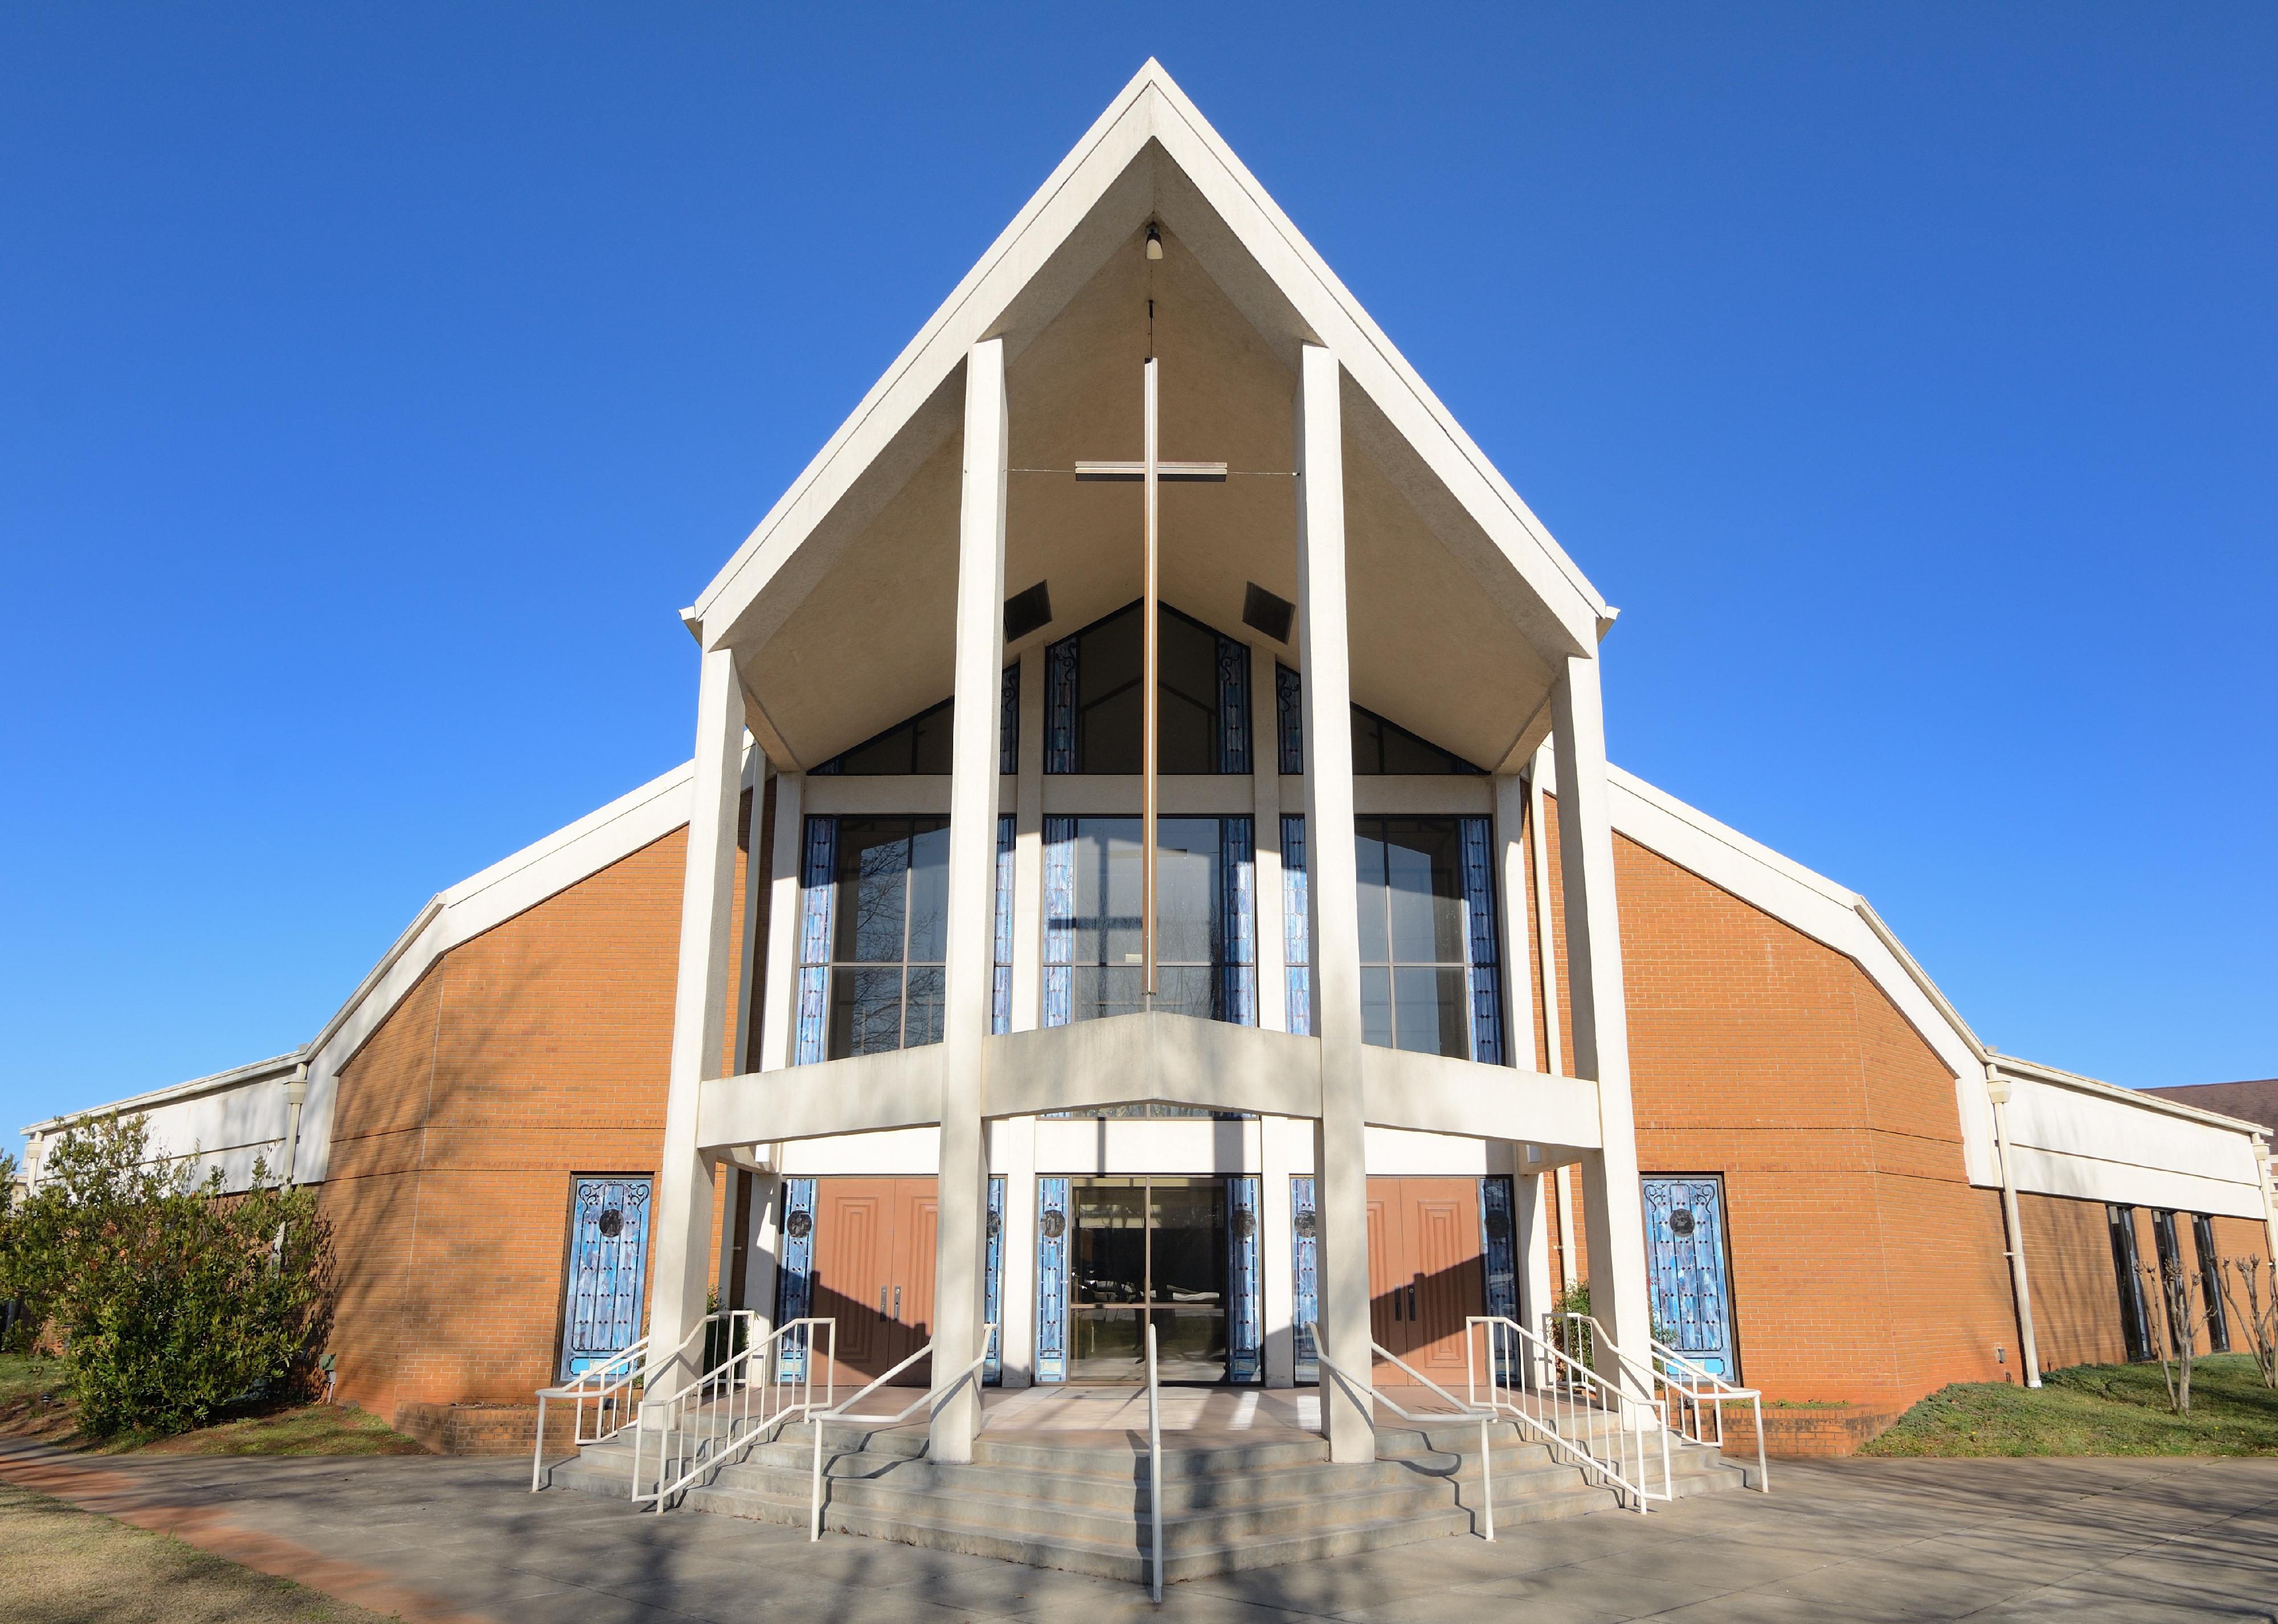
#11. Religious worship
– Annual energy use for religious worship: 27B kilowatt-hours (61K kilowatt-hours per building)
It’s no surprise that nearly half of a religious worship space’s energy expenditure goes towards heating. Many of these buildings are notoriously old, open, and/or drafty, meaning that insulation is poor. Oftentimes, high ceilings allow heat to rise far above occupants, requiring more energy to keep the space comfortable. Many particularly old spaces were built with outdated systems that are not energy-efficient.

Memory Stockphoto // Shutterstock
#10. Service
– Annual energy use for service: 45B kilowatt-hours (52K kilowatt-hours per building)
— Post office or postal center: 5B kilowatt-hours (145K kilowatt-hours per building)
— Vehicle service or repair: 12B kilowatt-hours (44K kilowatt-hours per building)
— Vehicle storage or maintenance: 14B kilowatt-hours (38K kilowatt-hours per building)
— Other service: 14B kilowatt-hours (71K kilowatt-hours per building)
At least 50% of a service building’s energy is spent on heating, more than any other commercial industry. Lighting also makes up a significant portion of their energy, at nearly 20%. For vehicle service and repair buildings, garages and maintenance areas require large amounts of energy, although cooling energy can be cut down by using natural airflow from garage doors in the warm months. Lighting, ventilation, and welding and power equipment all require large amounts of electricity in these areas as well. In post offices, dock doors where trucks are loaded can result in poor insulation when not closed properly, resulting in inefficient use of heating systems.

Kunal Mehta // Shutterstock
#9. Food sales
– Annual energy use for food sales: 54B kilowatt-hours (329K kilowatt-hours per building)
— Convenience store (with or without gas station): 19B kilowatt-hours (156K kilowatt-hours per building)
— Grocery store or food market: 34B kilowatt-hours (1.0 million kWh per building)
Food sales buildings have the largest proportion of energy used towards refrigeration, at nearly 40%. Though overall energy intensity is relatively the same between food sales and food service buildings, food sales buildings have a higher electricity intensity compared to natural gas. Such buildings tend to have extended service hours compared to other commercial buildings, upping their energy consumption.

ZoranOrcik // Shutterstock
#8. Food service
– Annual energy use for food service: 61B kilowatt-hours (212K kilowatt-hours per building)
— Fast food: 18B kilowatt-hours (260K kilowatt-hours per building)
— Restaurant or cafeteria: 37B kilowatt-hours (214K kilowatt-hours per building)
— Other food service: 5B kilowatt-hours (120K kilowatt-hours per building)
Food service is one of the three highest energy-intensive industries. Unsurprisingly, it eclipses all other commercial industries in the proportion of energy that is dedicated to cooking, at around 40%. This can include food preparation meant for mass consumption, but not small-scale or personal preparation like vending machines, coffee pots, or microwaves.

Gorodenkoff // Shutterstock
#7. Public assembly
– Annual energy use for public assembly: 87B kilowatt-hours (179K kilowatt-hours per building)
— Library: 7B kilowatt-hours (267K kilowatt-hours per building)
— Entertainment or culture: 17B kilowatt-hours (246K kilowatt-hours per building)
— Recreation: 30B kilowatt-hours (195K kilowatt-hours per building)
— Social or meeting: 26B kilowatt-hours (116K kilowatt-hours per building)
— Other assembly: 8B kilowatt-hours (397K kilowatt-hours per building)
Public assembly buildings expend nearly half of their energy use on heating and around 20% on cooling the space. Movie theaters tend to use higher amounts of energy for air conditioning, but perhaps less than expected for ventilation. Those large screens and booming sound systems also demand large amounts of electricity, although if enough people attend a film screening, it can actually be more energy-efficient than a single person watching alone at home.

Roman Vyshnikov // Shutterstock
#6. Warehouses and storage
– Annual energy use for warehouses and storage: 95B kilowatt-hours (120K kilowatt-hours per building)
— Nonrefrigerated: 85B kilowatt-hours (108K kilowatt-hours per building)
— Refrigerated: 10B kilowatt-hours (2.8 million kWh per building)
In general, warehouses expend about 40% of their energy on heating, 20% on lighting, and 10% on cooling, although there are differences depending on whether the facility is refrigerated or nonrefrigerated. Refrigerated warehouses store perishable or sensitive food and medicine products, including produce, seafood, nutritional supplements, vaccines, blood samples, and/or cosmetics. They naturally expend a large amount of energy on refrigeration and are projected to grow in use in the coming years.

Monkey Business Images // Shutterstock
#5. Health care
– Annual energy use for health care: 96B kilowatt-hours (698K kilowatt-hours per building)
— Inpatient: 65B kilowatt-hours (7.6 million kWh per building)
— Outpatient: 31B kilowatt-hours (238K kilowatt-hours per building)
Inpatient health care facilities are among the most energy-intensive commercial buildings for both heating and ventilation, completing the trio (along with food service and food sales) of the three most energy-intensive industries overall. Between inpatient and outpatient facilities, fairly similar percentages of energy are used for heating and cooling, although outpatient facilities used proportionally more energy towards lighting and ventilation.
Health care energy consumption is largely dominated by heating, cooling, ventilation, lighting, and running medical equipment. There are “strict air quality requirements for hospitals to maintain safety and comfort,” leading to extensive use of HVAC systems. Because hospitals run on a 24-hour basis, they also tend to dedicate more energy towards lighting and equipment than other industries.

antoniodiaz // Shutterstock
#4. Lodging
– Annual energy use for lodging: 100B kilowatt-hours (484K kilowatt-hours per building)
— Hotel: 46B kilowatt-hours (703K kilowatt-hours per building)
— Motel or inn: 9B kilowatt-hours (222K kilowatt-hours per building)
— Dormitory, fraternity, or sorority: 9B kilowatt-hours (268K kilowatt-hours per building)
— Nursing home or assisted living: 30B kilowatt-hours (788K kilowatt-hours per building)
— Other lodging: 6B kilowatt-hours (212K kilowatt-hours per building)
Lodging buildings dedicate fairly equal proportions of energy towards space heating and water heating—about 20% each—and slightly less towards cooking and ventilation. Hotels in particular can’t avoid using energy for nearly every amenity, including refrigeration, cooling, heating, cooking, lighting, gym equipment, pools, restaurants, bars, elevators, and office equipment.
Nursing homes, motels, and dormitories tend to offer the same amenities, albeit often on smaller scales. Because multiple people and families are residing in these buildings at once, it’s not just one refrigerator or computer working within a building, as is typical of residencies—it is often several working simultaneously, exponentially increasing energy use.
legenda // Shutterstock
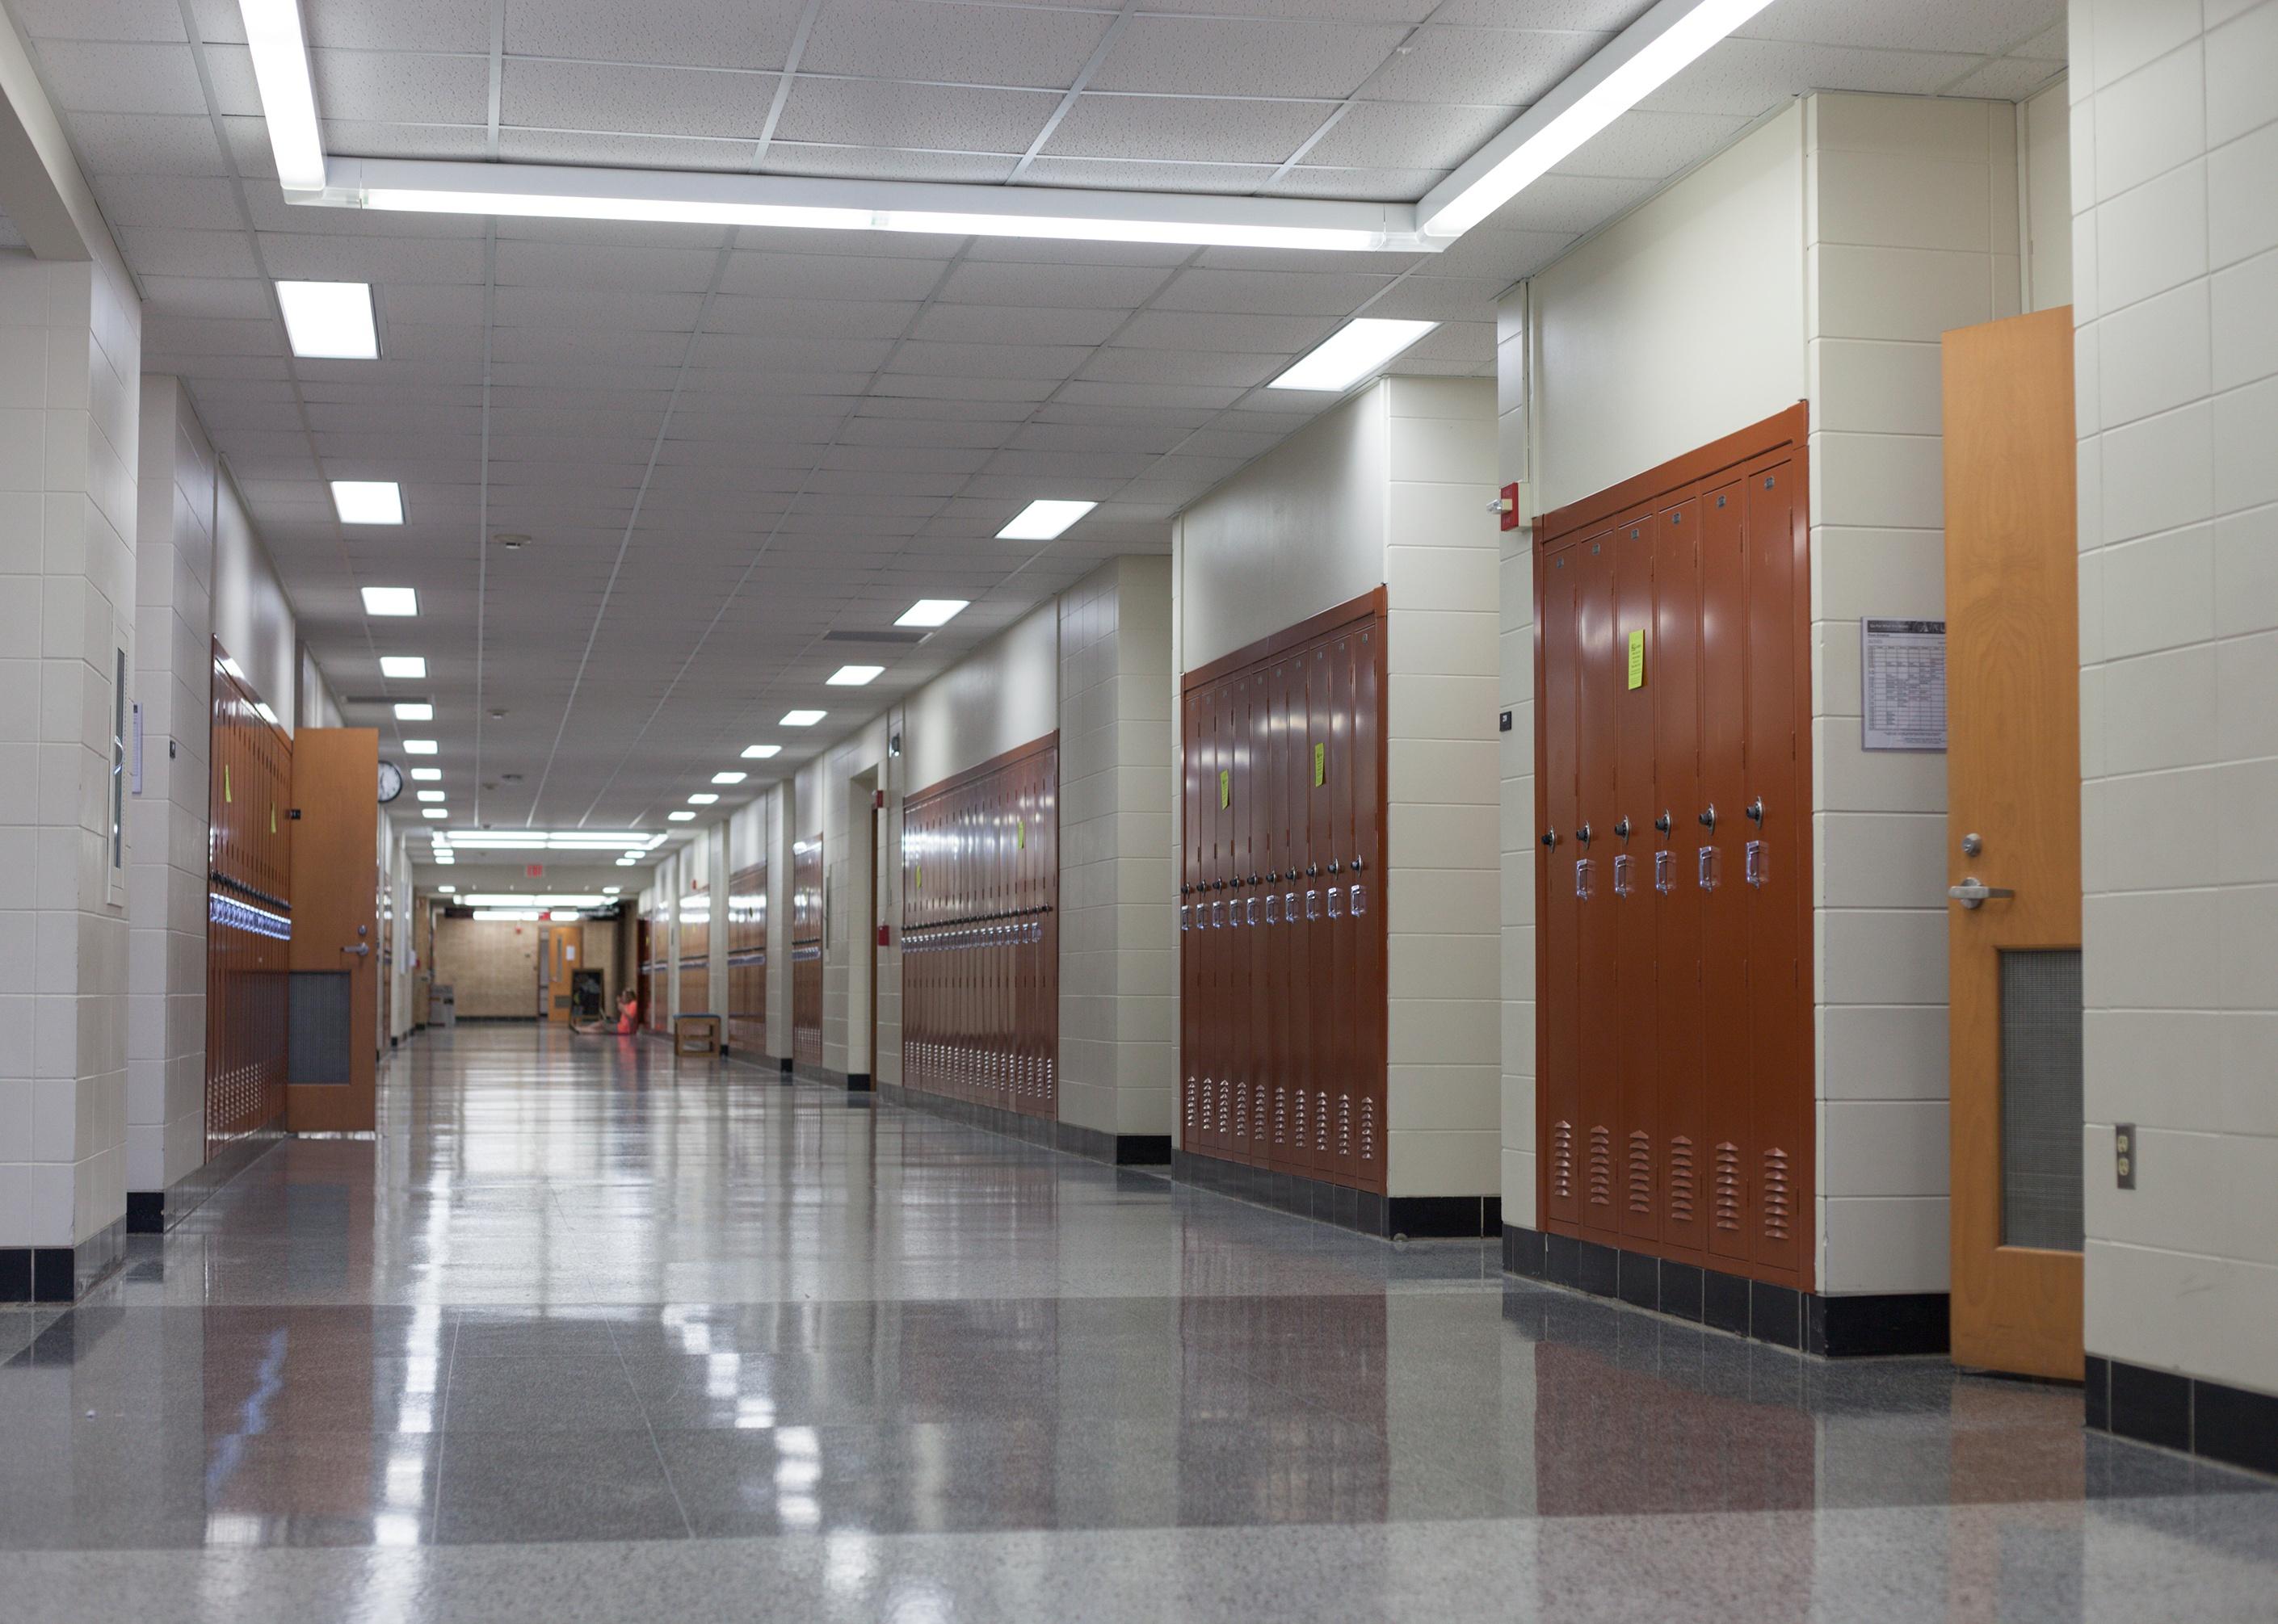
#3. Education
– Annual energy use for education: 128B kilowatt-hours (293K kilowatt-hours per building)
— College or university: 23B kilowatt-hours (385K kilowatt-hours per building)
— K-12: 96B kilowatt-hours (365K kilowatt-hours per building)
— Multi-grade school (any K–12): 14B kilowatt-hours (397K kilowatt-hours per building)
— Preschool or day care: 4B kilowatt-hours (49K kilowatt-hours per building)
— Other classroom education: 5B kilowatt-hours (151K kilowatt-hours per building)
A little over 40% of energy expenditures for education were spent on heating and around 10% on cooling. Computers, vending machines, and other appliances are often left on continuously. Schools are particularly bad at maintaining energy efficiency by keeping lights on in unoccupied rooms and hallways: One school in Massachusetts has had their building lights on for a year and a half straight.

Radu Bercan // Shutterstock
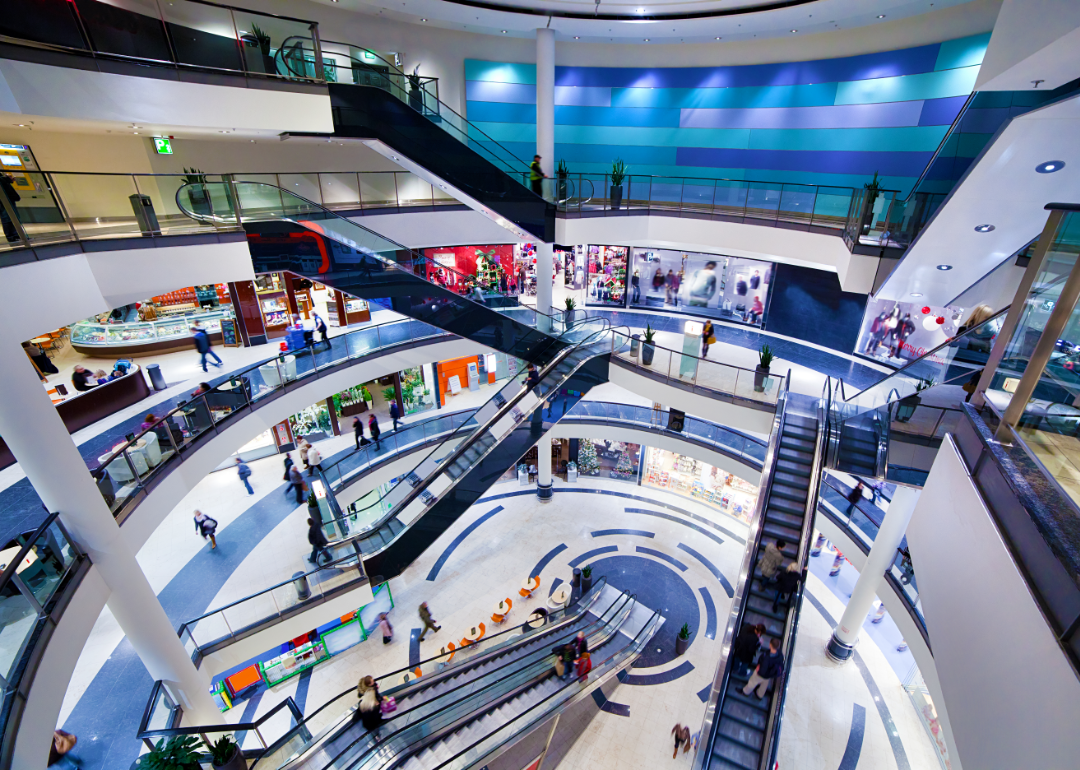
#2. Mercantile use
– Annual energy use for mercantile use: 180B kilowatt-hours (352K kilowatt-hours per building)
— Retail (other than mall): 71B kilowatt-hours (205K kilowatt-hours per building)
— Enclosed and strip malls: 109B kilowatt-hours (657K kilowatt-hours per building)
Mercantile buildings expend about a quarter of their energy on heating, though retail footprints located outside of mall environments tend to use comparatively more of their energy expenditure on lighting and ventilation. Malls use proportionally more energy on cooking, refrigeration, and water heating, possibly due to food courts and food vendors existing alongside shops. Other sources of energy use include both interior and exterior lighting (think of those large neon signs beckoning you to explore stores and sales), computers and tablets used at checkout, and water fountains and vending machines.

Monkey Business Images // Shutterstock
#1. Offices
– Annual energy use for offices: 227B kilowatt-hours (234K kilowatt-hours per building)
— Administrative or professional: 126B kilowatt-hours (227K kilowatt-hours per building)
— Bank or other financial: 9B kilowatt-hours (193K kilowatt-hours per building)
— Government: 32B kilowatt-hours (251K kilowatt-hours per building)
— Medical (nondiagnostic): 5B kilowatt-hours (99K kilowatt-hours per building)
— Mixed-use: 50B kilowatt-hours (423K kilowatt-hours per building)
— Other office: 5B kilowatt-hours (69K kilowatt-hours per building)
Offices are the second-highest commercial users of computing systems, second only to computing-heavy data centers. Computing here can include the use of computers, laptops, monitors, and servers. The largest proportion of an office’s energy is spent on heating, ventilating, and lighting. Water heaters, server rooms, and some lighting fixtures are designed to operate continuously within office spaces to ensure uninterrupted functionality.
This story originally appeared on LED Lighting Supply and was produced and
distributed in partnership with Stacker Studio.


You walk into a fast-food restaurant on your lunch break. You don’t see a cashier but instead a self-service kiosk, a technology that is becoming the new norm in eateries across the country. The kiosks usually offer customers a menu to scroll through and pictures of meals and specials with prompts to select their food and submit their payment in one place.
Self-service kiosks are big business. In fact, the market for self-service products is expected to grow from a $40.3 billion market value in 2022 to $63 billion by 2027, according to a report from BCC Research. Consumers do have mixed opinions about the kiosks, but about 3 out of 5 surveyed consumers reported that they were likely to use self-service kiosks, according to the National Restaurant Association. The technology, while expensive, can boost businesses’ bottom lines in the long run.
Task Group summarized the rise in digital ordering over the past couple of years, its acceptance among customers, and a cost analysis of adopting the technology.
Self-service kiosks—digital machines or display booths—are generally placed in high-traffic areas. They can be used for different reasons, including navigating a store or promoting a product. Interactive self-service kiosks in particular are meant for consumers to place orders with little to no assistance from employees.
The idea of kiosks isn’t new. The concept of self-service was first introduced in the 1880s when the first types of kiosks appeared as vending machines selling items like gum and postcards. In the present age of technology, the trend of self-service has only grown. Restaurants such as McDonald’s and Starbucks have already tried out cashierless technology.
From a business perspective, the kiosks offer a huge upside. While many employers are looking for workers, they’re having a hard time finding staff. In the midst of the COVID-19 pandemic, employers struggled with a severe employee shortage. Since then, the problem has continued. In 2022, the National Restaurant Association reported that 65% of restaurant operators didn’t have enough workers on staff to meet consumer demand. With labor shortages running rampant, cashierless technology could help restaurants fill in for the lack of human employees.
The initial investment for the kiosks can be high. The general cost per kiosk is difficult to quantify, with one manufacturer estimating a range of $1,500 to $20,000 per station. However, with the use of kiosks, restaurants may not need as many cashiers or front-end employees, instead reallocating workers’ time to other tasks.
In May 2022, the hourly mean wage for cashiers who worked in restaurants and other eating establishments was $12.99, according to the Bureau of Labor Statistics. Kiosks could cost less money than a cashier in the long run.
But how do the customers themselves feel about the growing trend? According to a Deloitte survey, 62% of respondents report that they were “somewhat likely” to order from a cashierless restaurant if given the chance to do so. The same survey reported that only 19% of respondents had experience with a cashierless restaurant.
What would it mean for society if restaurants did decide to go completely cashierless? Well, millions of positions would likely no longer be necessary. One report suggests 82% of restaurant positions could be replaced by robots, a prospect making automation appealing to owners who can’t find staff to hire.
Due to the ongoing labor shortage, employers have tried raising employee wages. Papa John’s, Texas Roadhouse, and Chipotle were among the restaurant companies that increased employee pay or offered bonuses in an attempt to hire and retain more workers. Meanwhile, some companies have decided to use technology to perform those jobs instead, so that they wouldn’t have to put effort into hiring or focus their existing staff on other roles.
Story editing by Ashleigh Graf and Jeff Inglis. Copy editing by Tim Bruns.
![]()
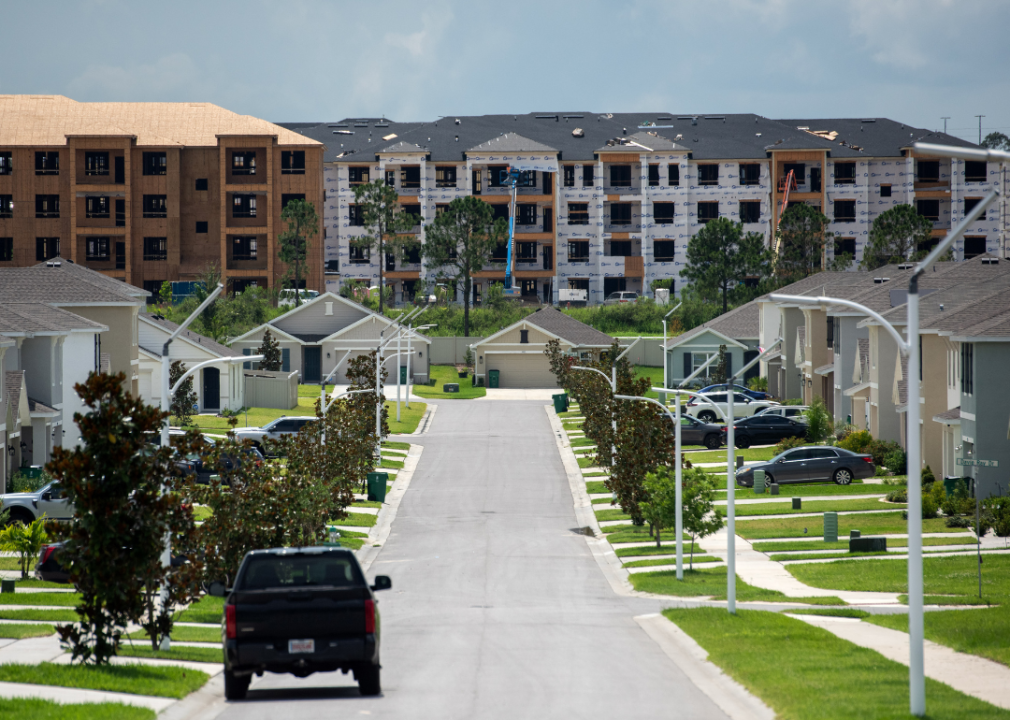
It’s well-documented that the surest, and often best, return on investments comes from playing the long game. But between stocks and real estate, which is the stronger bet?
To find out, financial planning firm Wealth Enhancement Group analyzed data from academic research, Standard and Poor’s, and Nareit to see how real estate compares to stocks as an investment.
Data going back to 1870 shows the well-established power of real estate as a powerful “long-run investment.” From 1870-2015, and after adjusting for inflation, real estate produced an average annual return of 7.05%, compared to 6.89% for equities. These findings, published in the 2019 issue of The Quarterly Journal of Economics, illustrate that stocks can deviate as much as 22% from their average, while housing only spreads out 10%. That’s because despite having comparable returns, stocks are inherently more volatile due to following the whims of the business cycle.
Real estate has inherent benefits, from unlocking cash flow and offering tax breaks to building equity and protecting investors from inflation. Investments here also help to diversify a portfolio, whether via physical properties or a real estate investment trust. Investors can track markets with standard resources that include the S&P CoreLogic Case-Shiller Home Price Indices, which tracks residential real estate prices; the Nareit U.S. Real Estate Index, which gathers data on the real estate investment trust, or REIT, industry; and the S&P 500, which tracks the stocks of 500 of the largest companies in the U.S.
High interest rates and a competitive market dampened the flurry of real-estate investments made in the last four years. The rise in interest rates equates to a bigger borrowing cost for investors, which can spell big reductions in profit margins. That, combined with the risk of high vacancies, difficult tenants, or hidden structural problems, can make real estate investing a less attractive option—especially for first-time investors.
Keep reading to learn more about whether real estate is a good investment today and how it stacks up against the stock market.
![]()
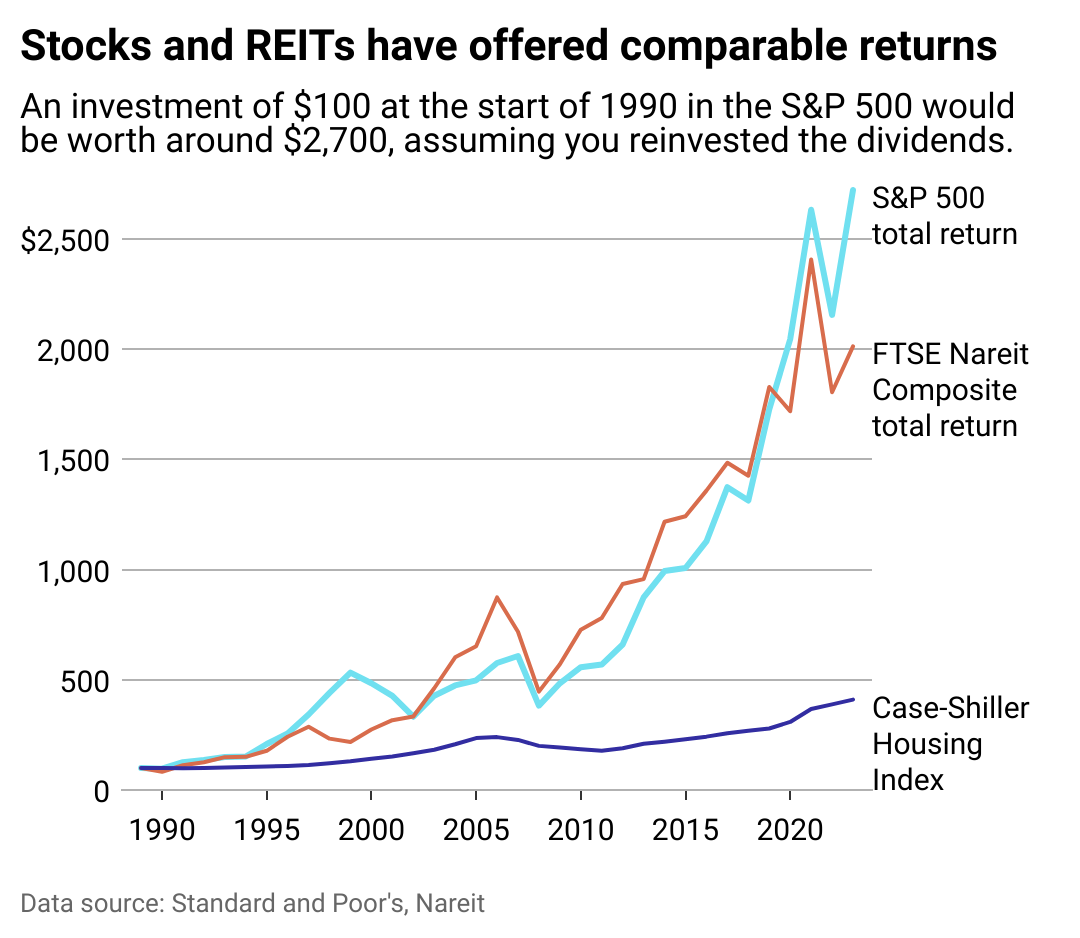
Wealth Enhancement Group
Stocks and housing have both done well
REITs can offer investors the stability of real estate returns without bidding wars or hefty down payments. A hybrid model of stocks and real estate, REITs allow the average person to invest in businesses that finance or own income-generating properties.
REITs delivered slightly better returns than the S&P 500 over the past 20-, 25-, and 50-year blocks. However, in the short term—the last 10 years, for instance—stocks outperformed REITs with a 12% return versus 9.5%, according to data compiled by The Motley Fool investor publication.
Whether a new normal is emerging that stocks will continue to offer higher REITs remains to be seen.
This year, the S&P 500 reached an all-time high, courtesy of investor enthusiasm in speculative tech such as artificial intelligence. However, just seven tech companies, dubbed “The Magnificent 7,” are responsible for an outsized amount of the S&P’s returns last year, creating worry that there may be a tech bubble.
While indexes keep a pulse on investment performance, they don’t always tell the whole story. The Case-Shiller Index only measures housing prices, for example, which leaves out rental income (profit) or maintenance costs (loss) when calculating the return on residential real estate investment.
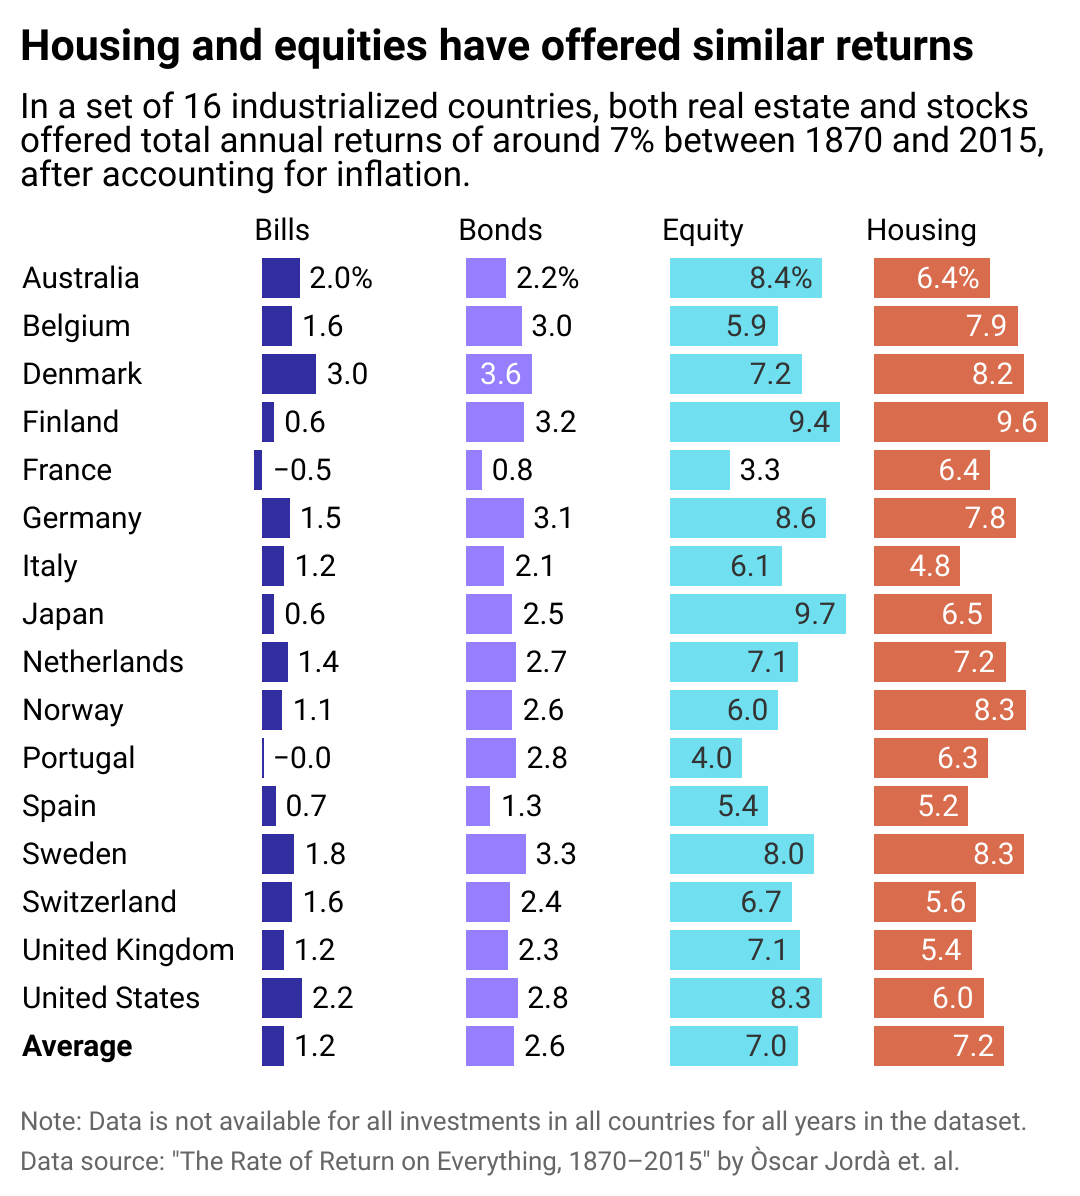
Wealth Enhancement Group
Housing returns have been strong globally too
Like its American peers, the global real estate market in industrialized nations offers comparable returns to the international stock market.
Over the long term, returns on stocks in industrialized nations is 7%, including dividends, and 7.2% in global real estate, including rental income some investors receive from properties. Investing internationally may have more risk for American buyers, who are less likely to know local rules and regulations in foreign countries; however, global markets may offer opportunities for a higher return. For instance, Portugal’s real estate market is booming due to international visitors deciding to move there for a better quality of life. Portugal’s housing offers a 6.3% return in the long term, versus only 4.3% for its stock market.
For those with deep enough pockets to stay in, investing in housing will almost always bear out as long as the buyer has enough equity to manage unforeseen expenses and wait out vacancies or slumps in the market. Real estate promises to appreciate over the long term, offers an opportunity to collect rent for income, and allows investors to leverage borrowed capital to increase additional returns on investment.
Above all, though, the diversification of assets is the surest way to guarantee a strong return on investments. Spreading investments across different assets increases potential returns and mitigates risk.
Story editing by Nicole Caldwell. Copy editing by Paris Close. Photo selection by Lacy Kerrick.
This story originally appeared on Wealth Enhancement Group and was produced and
distributed in partnership with Stacker Studio.
In today’s digital climate, consuming sports has never been easier. Thanks to a plethora of streaming sites, alternative broadcasts, and advancements to home entertainment systems, the average fan has myriad options to watch and learn about their favorite teams at the touch of a button—all without ever having to leave the couch.
As a result, more and more sports venues have committed to improving and modernizing their facilities and fan experiences to compete with at-home audiences. Consider using mobile ticketing and parking passes, self-service kiosks for entry and ordering food, enhanced video boards, and jumbotrons that supply data analytics and high-definition replays. These innovations and upgrades are meant to draw more revenue and attract various sponsored partners. They also deliver unique and convenient in-person experiences that rival and outmatch traditional ways of enjoying games.
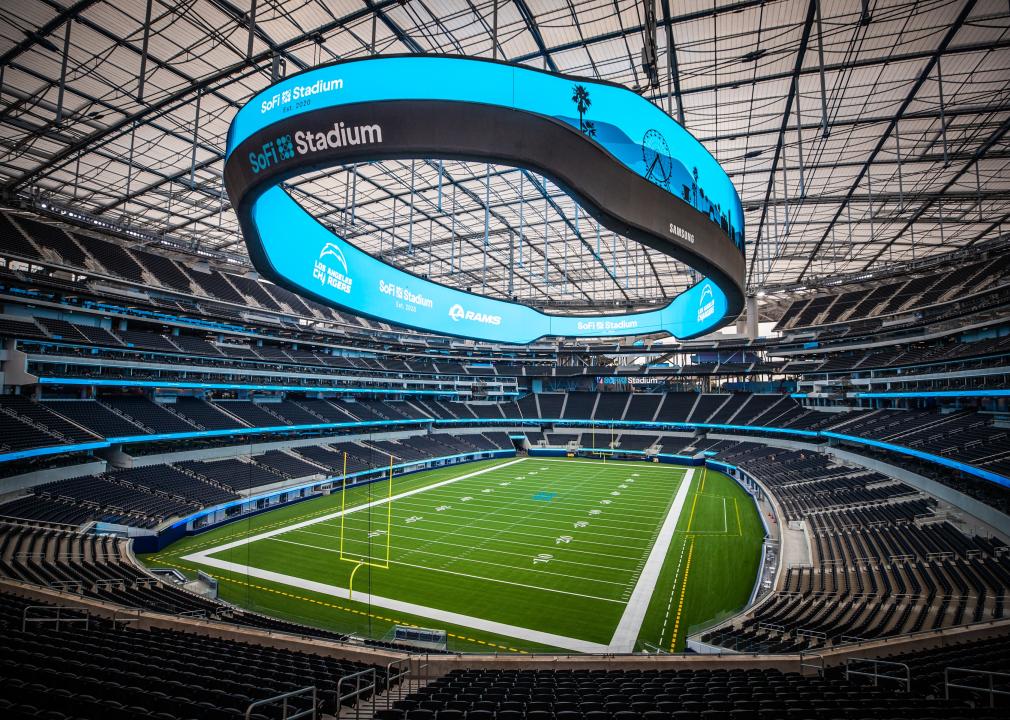
In Los Angeles, the Rams and Chargers’ SoFi Stadium has become the gold standard for football venues. It’s an architectural wonder with closer views, enhanced hospitality, and a translucent roof that cools the stadium’s internal temperature.
The Texas Rangers’ ballpark, Globe Life Field, added field-level suites and lounges that resemble the look and feel of a sports bar. Meanwhile, the Los Angeles Clippers are building a new arena (in addition to retail space, team offices, and an outdoor public plaza) that will seat 18,000 people and feature a fan section called The Wall, which will regulate attire and rooting interest.
It’s no longer acceptable to operate with old-school facilities and technology. Just look at Commanders Field (formerly FedExField), home of the Washington Commanders, which has faced criticism for its faulty barriers, leaking ceilings, poor food options, and long lines. Understandably, the team has been attempting to find a new location to build a state-of-the-art stadium and keep up with the demand for high-end amenities.
As more organizations audit their stadiums and arenas and keep up with technological innovations, Uniqode compiled a list of the latest tech advancements to coax—and keep—fans inside venues.
![]()
Jeff Gritchen/MediaNews Group/Orange County Register // Getty Images
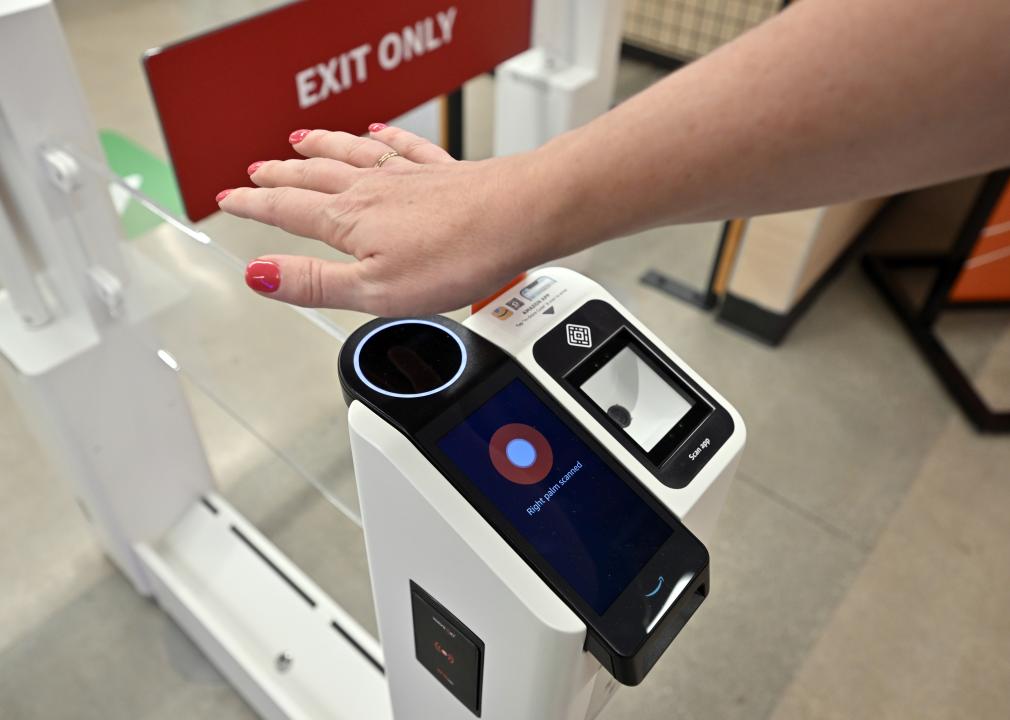
Just Walk Out technology
After successfully installing its first cashierless grocery store in 2020, Amazon has continued to put its tracking technology into practice.
In 2023, the Seahawks incorporated Just Walk Out technology at various merchandise stores throughout Lumen Field, allowing fans to purchase items with a swipe and scan of their palms.
The radio-frequency identification system, which involves overhead cameras and computer vision, is a substitute for cashiers and eliminates long lines.
RFID is now found in a handful of stadiums and arenas nationwide. These stores have already curbed checkout wait times, eliminated theft, and freed up workers to assist shoppers, according to Jon Jenkins, vice president of Just Walk Out tech.
Billie Weiss/Boston Red Sox // Getty Images
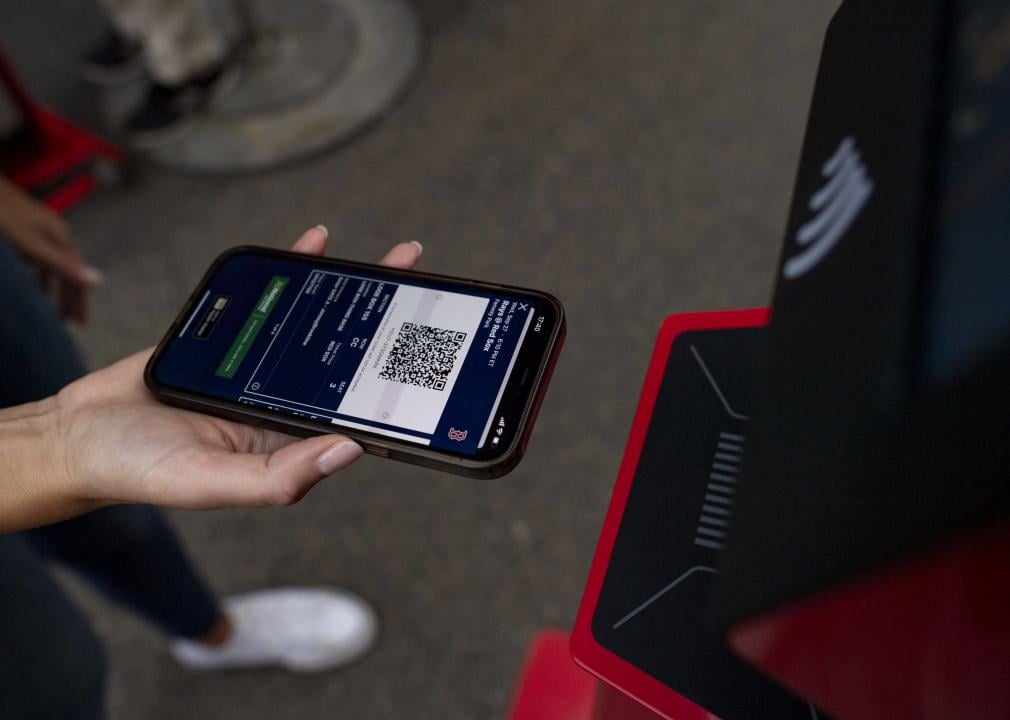
Self-serve kiosks
In the same vein as Amazon’s self-scanning technology, self-serve kiosks have become a more integrated part of professional stadiums and arenas over the last few years. Some of these function as top-tier vending machines with canned beers and nonalcoholic drinks, shuffling lines quicker with virtual bartenders capable of spinning cocktails and mixed drinks.
The kiosks extend past beverages, as many college and professional venues have started using them to scan printed and digital tickets for more efficient entrance. It’s an effort to cut down lines and limit the more tedious aspects of in-person attendance, and it’s led various competing kiosk brands to provide their specific conveniences.

Kyle Rivas // Getty Images
Mobile ordering
Is there anything worse than navigating the concourse for food and alcohol and subsequently missing a go-ahead home run, clutch double play, or diving catch?
Within the last few years, more stadiums have eliminated those worries thanks to contactless mobile ordering. Fans can select food and drink items online on their phones to be delivered right to their seats. Nearly half of consumers said mobile app ordering would influence them to make more restaurant purchases, according to a 2020 study at PYMNTS. Another study showed a 22% increase in order size.
Many venues, including Yankee Stadium, have taken notice and now offer personalized deliveries in certain sections and established mobile order pick-up zones throughout the ballpark.
Darrian Traynor // Getty Images
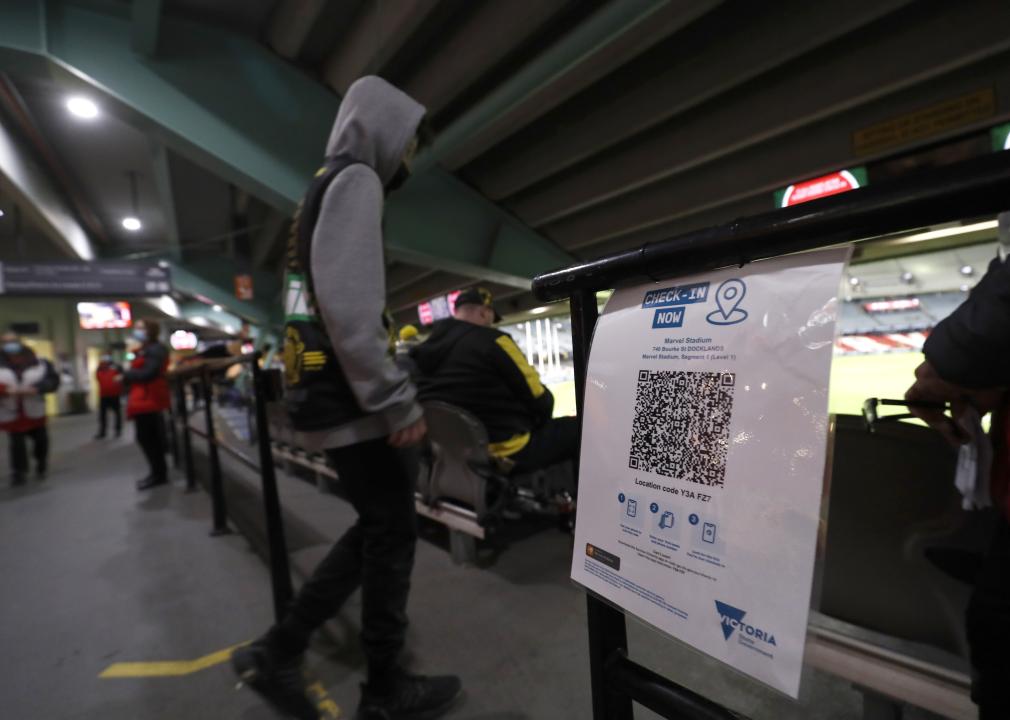
QR codes at seats
Need to remember a player’s name? Want to look up an opponent’s statistics at halftime? The team at Digital Seat Media has you covered.
Thus far, the company has added seat tags to more than 50 venues—including two NFL stadiums—with QR codes to promote more engagement with the product on the field. After scanning the code, fans can access augmented reality features, look up rosters and scores, participate in sponsorship integrations, and answer fan polls on the mobile platform.
Boris Streubel/Getty Images for DFL // Getty Images
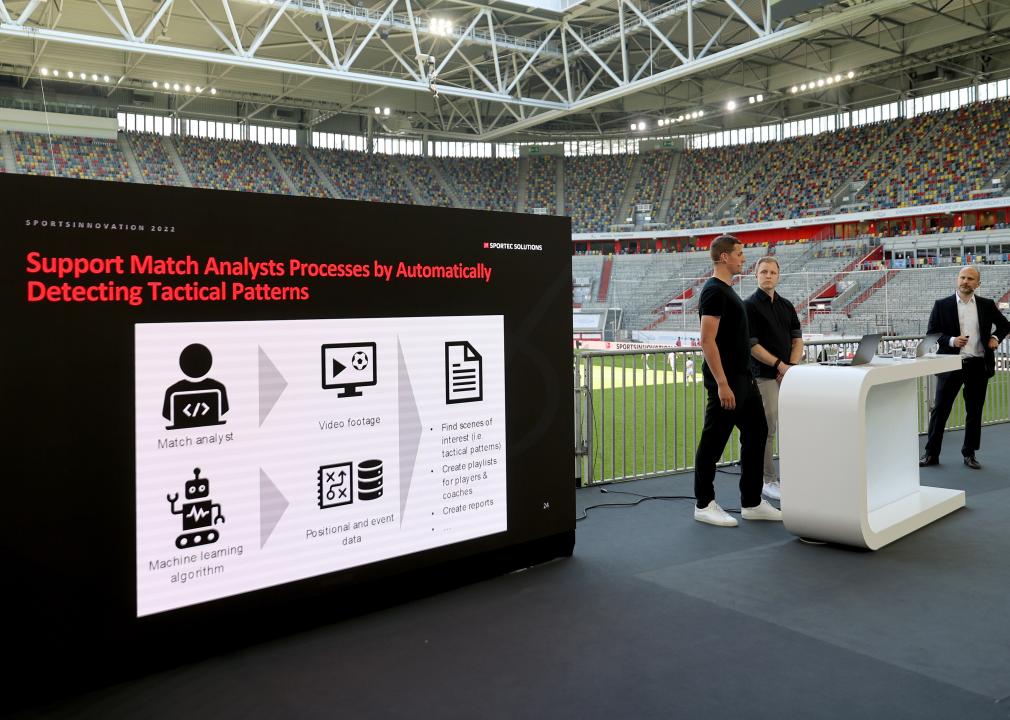
Real-time data analytics and generative AI
As more venues look to reinvigorate the in-stadium experience, some have started using generative artificial intelligence and real-time data analytics. Though not used widely yet, generative AI tools can create new content—text, imagery, or music—in conjunction with the game, providing updates, instant replays, and location-based dining suggestions
Last year, the Masters golf tournament even began including AI score projections in its mobile app. Real-time data is streamlining various stadium pitfalls, allowing operation managers to monitor staffing issues at busy food spots, adjust parking flows, and alert custodians to dirty or damaged bathrooms. The data also helps with security measures. Open up an app at a venue like the Honda Center in Anaheim, California, and report safety issues or belligerent fans to help better target disruptions and preserve an enjoyable experience.
Story editing by Nicole Caldwell. Copy editing by Paris Close. Photo selection by Lacy Kerrick.
This story originally appeared on Uniqode and was produced and
distributed in partnership with Stacker Studio.
-

 Business4 months ago
Skill-based hiring is the answer to labour shortages, BCG report finds
-

 Business5 months ago
mesh conference goes deep on AI, with experts focusing in on training, ethics, and risk
-

 Events3 months ago
The Northern Lights Technology & Innovation Forum comes to Calgary next month
-

 People4 months ago
How connected technologies trim rework and boost worker safety in hands-on industries
-

 Events6 months ago
Top 5 tech and digital transformation events to wrap up 2023